Figure Gallery
Publication-quality figures from the comprehensive Ag1000G Anopheles gambiae analysis. All plots are auto-generated from inference results across 16 African populations, 5 chromosome arms, 3 karyotype groups, and both intra- and inter-individual pair types.
Live results
These figures update automatically as inference completes. Sections marked
PENDING will populate as more populations finish processing. Re-run
generate_all_figures.py after syncing new results.
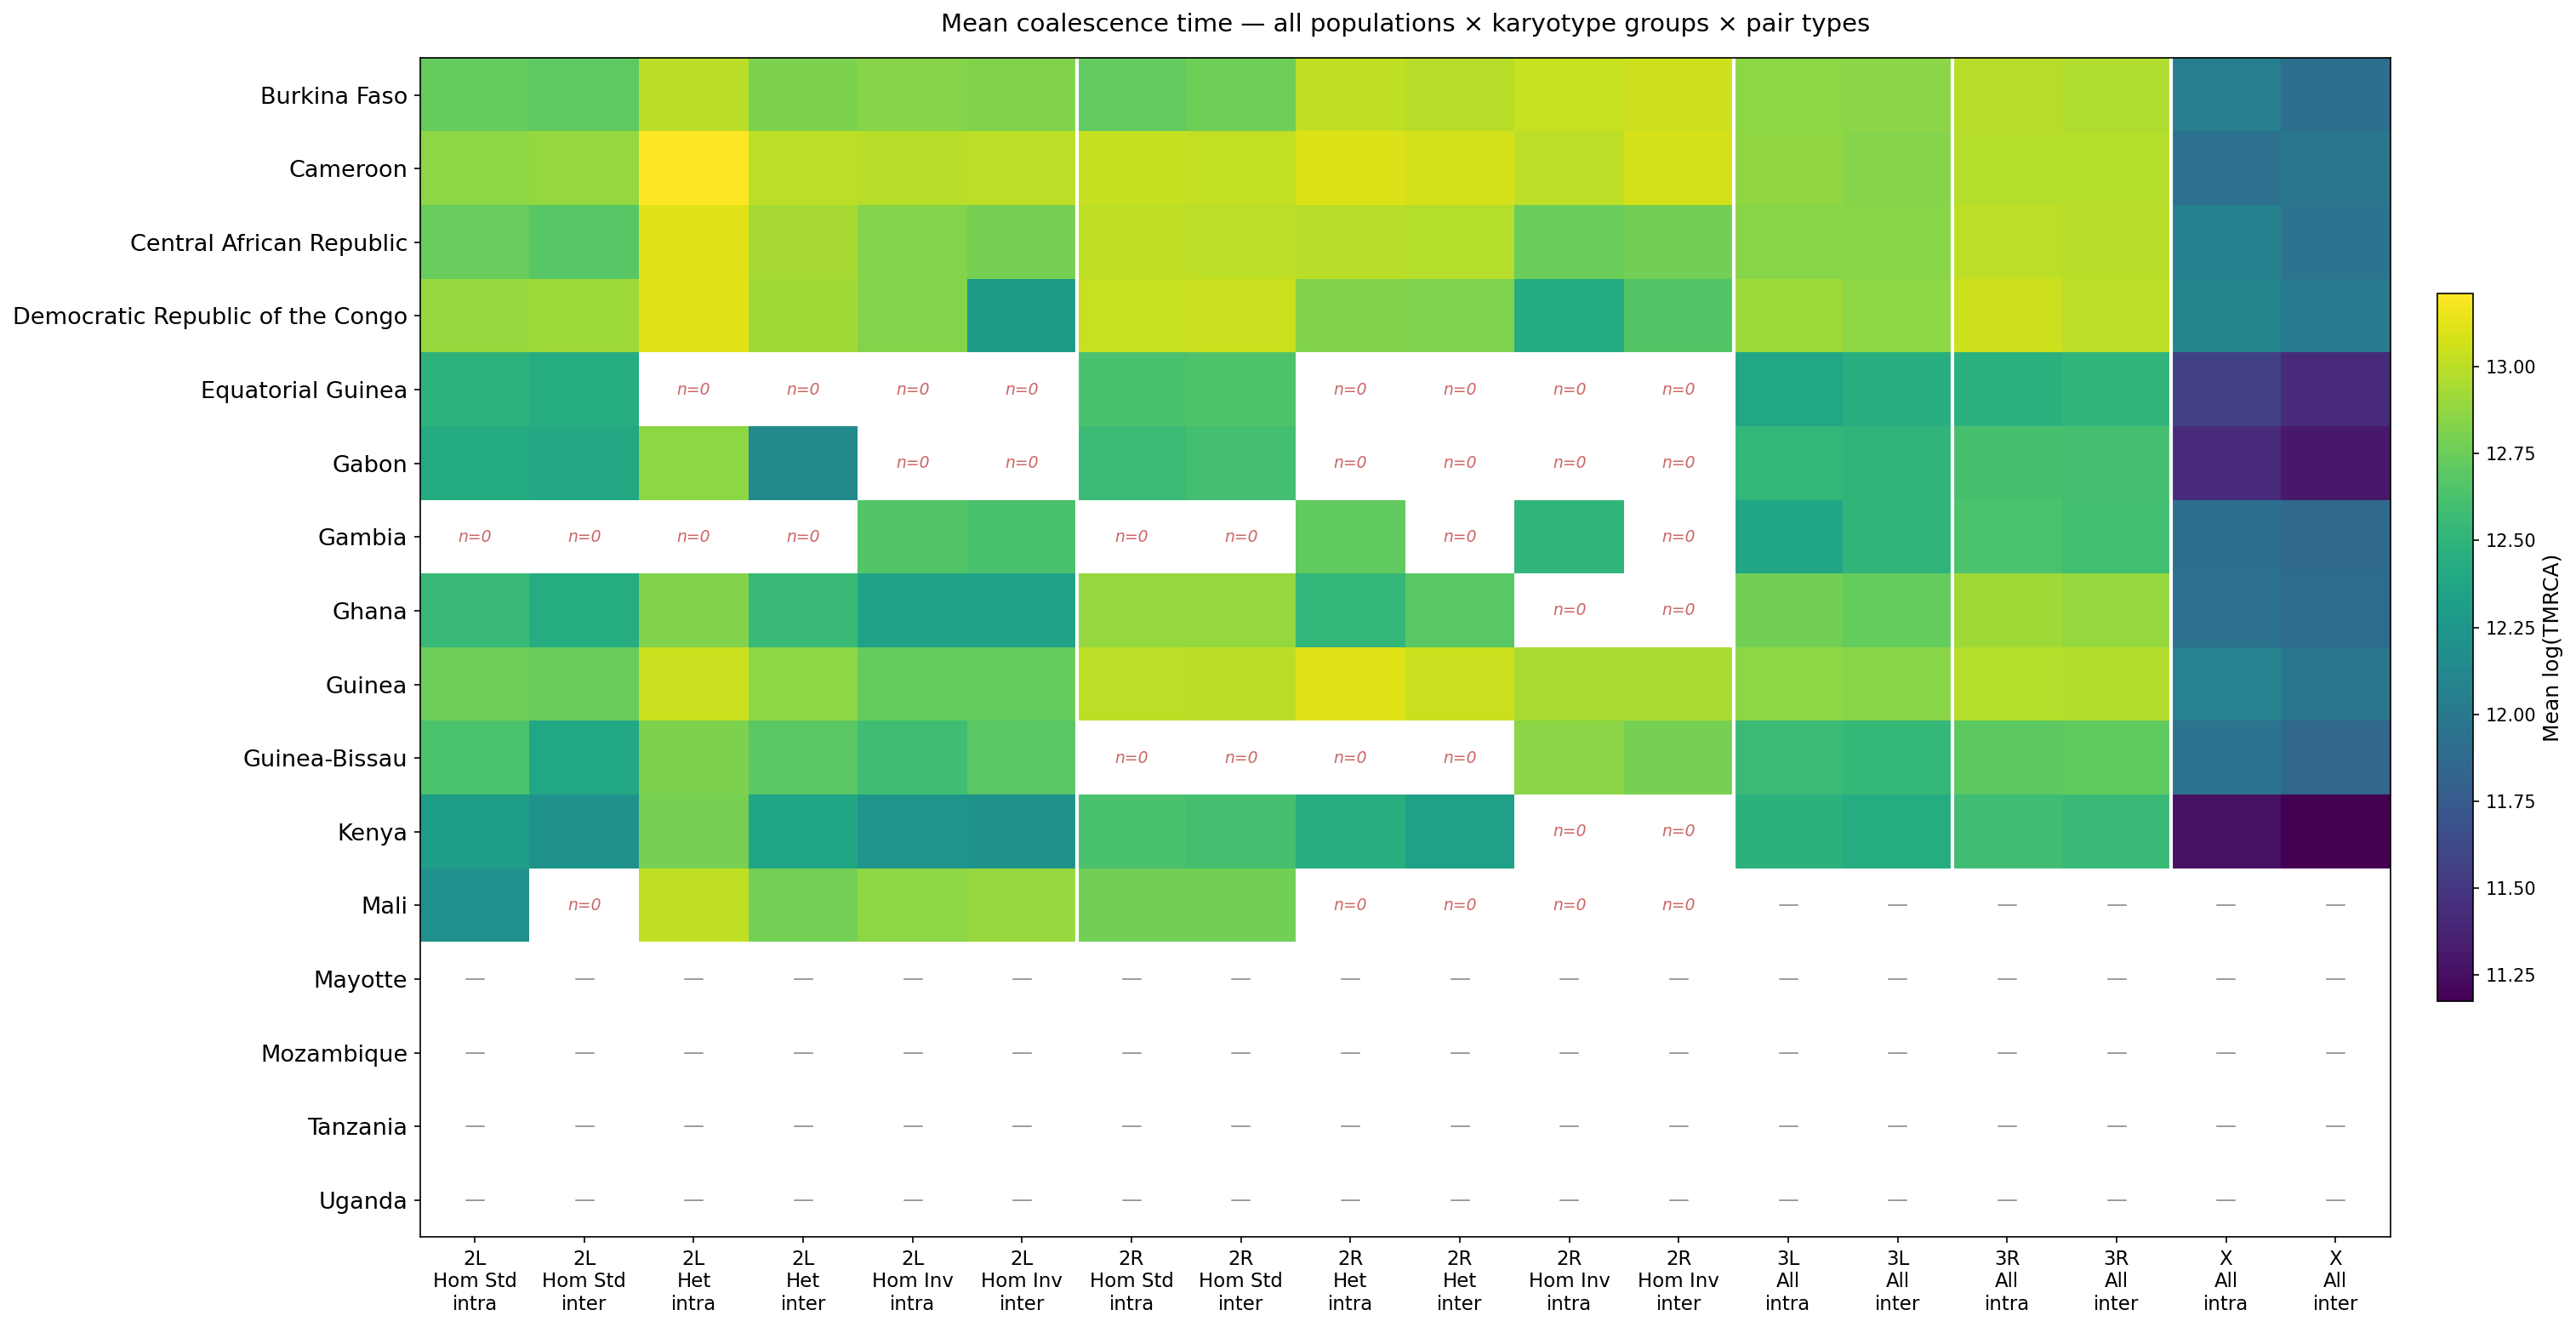
Overview
Cross-population summary of mean coalescence times across all karyotype groups and pair types.
Inversion Signals
Intra-individual coalescence along chromosome 2L reveals the In(2L)a inversion signature. Heterozygous individuals show deep coalescence inside the inversion where recombination is suppressed between standard and inverted arrangements. Homozygotes recombine freely within their arrangement.
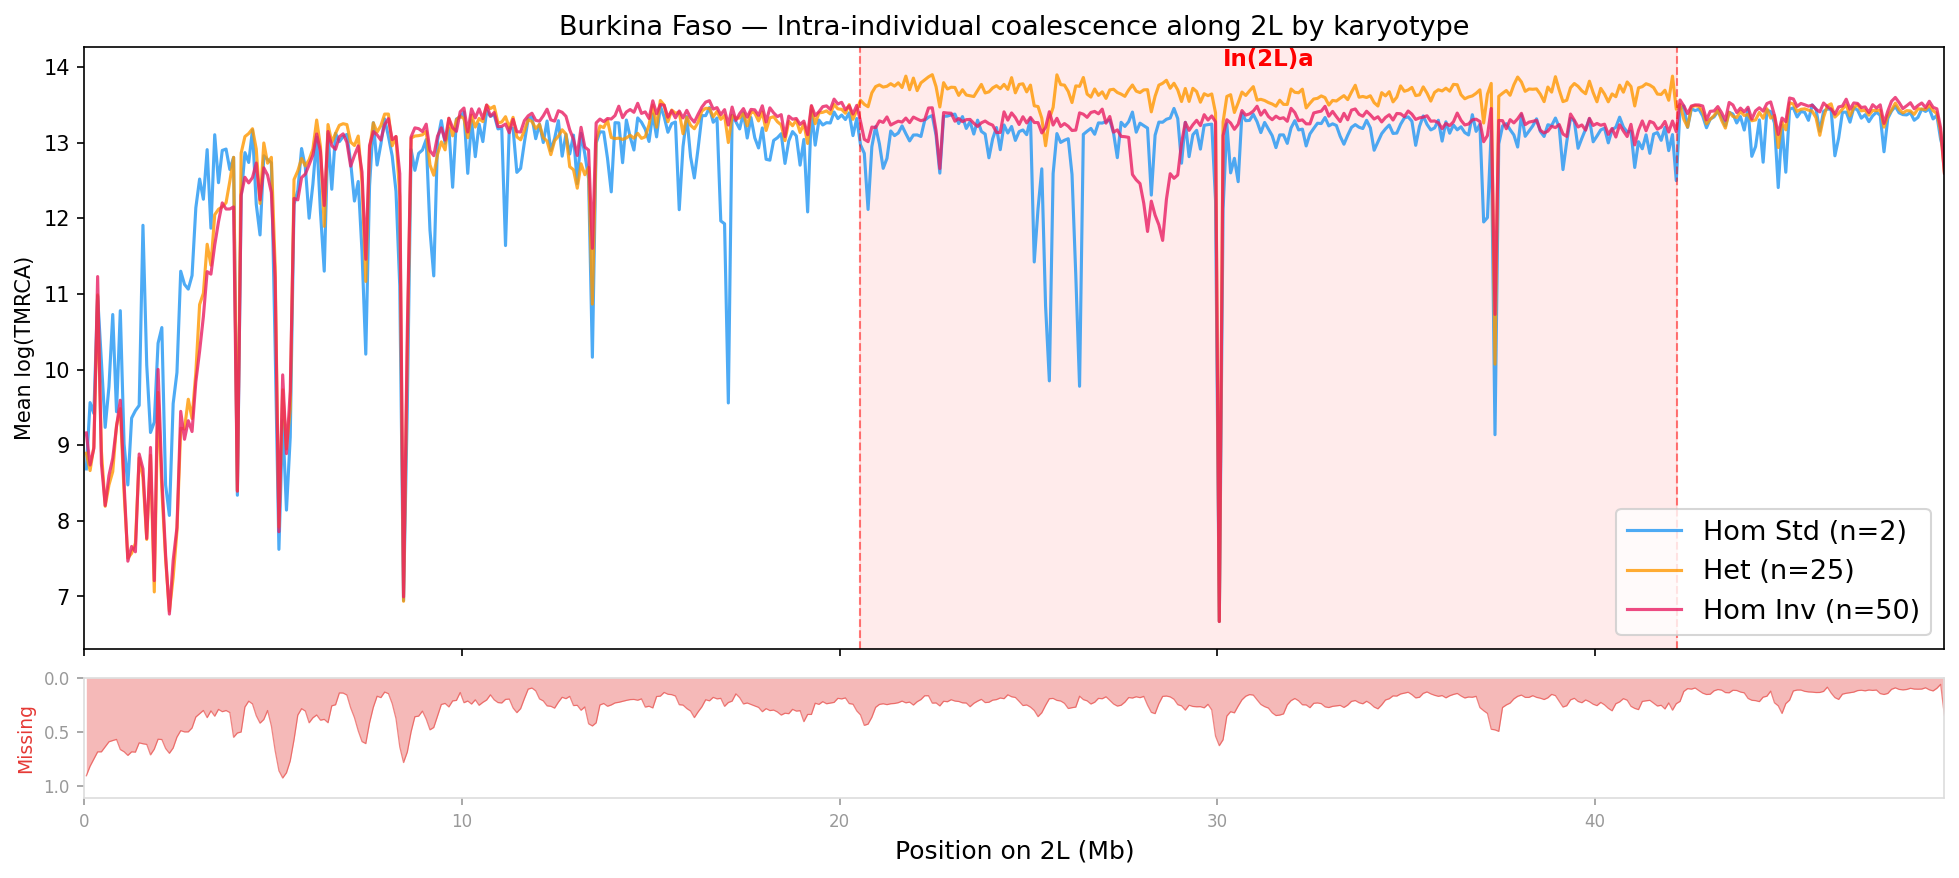
Burkina Faso — three karyotype groups overlaid. The red shaded region marks In(2L)a (20.5–42.2 Mb). Accessibility track at bottom shows data quality.
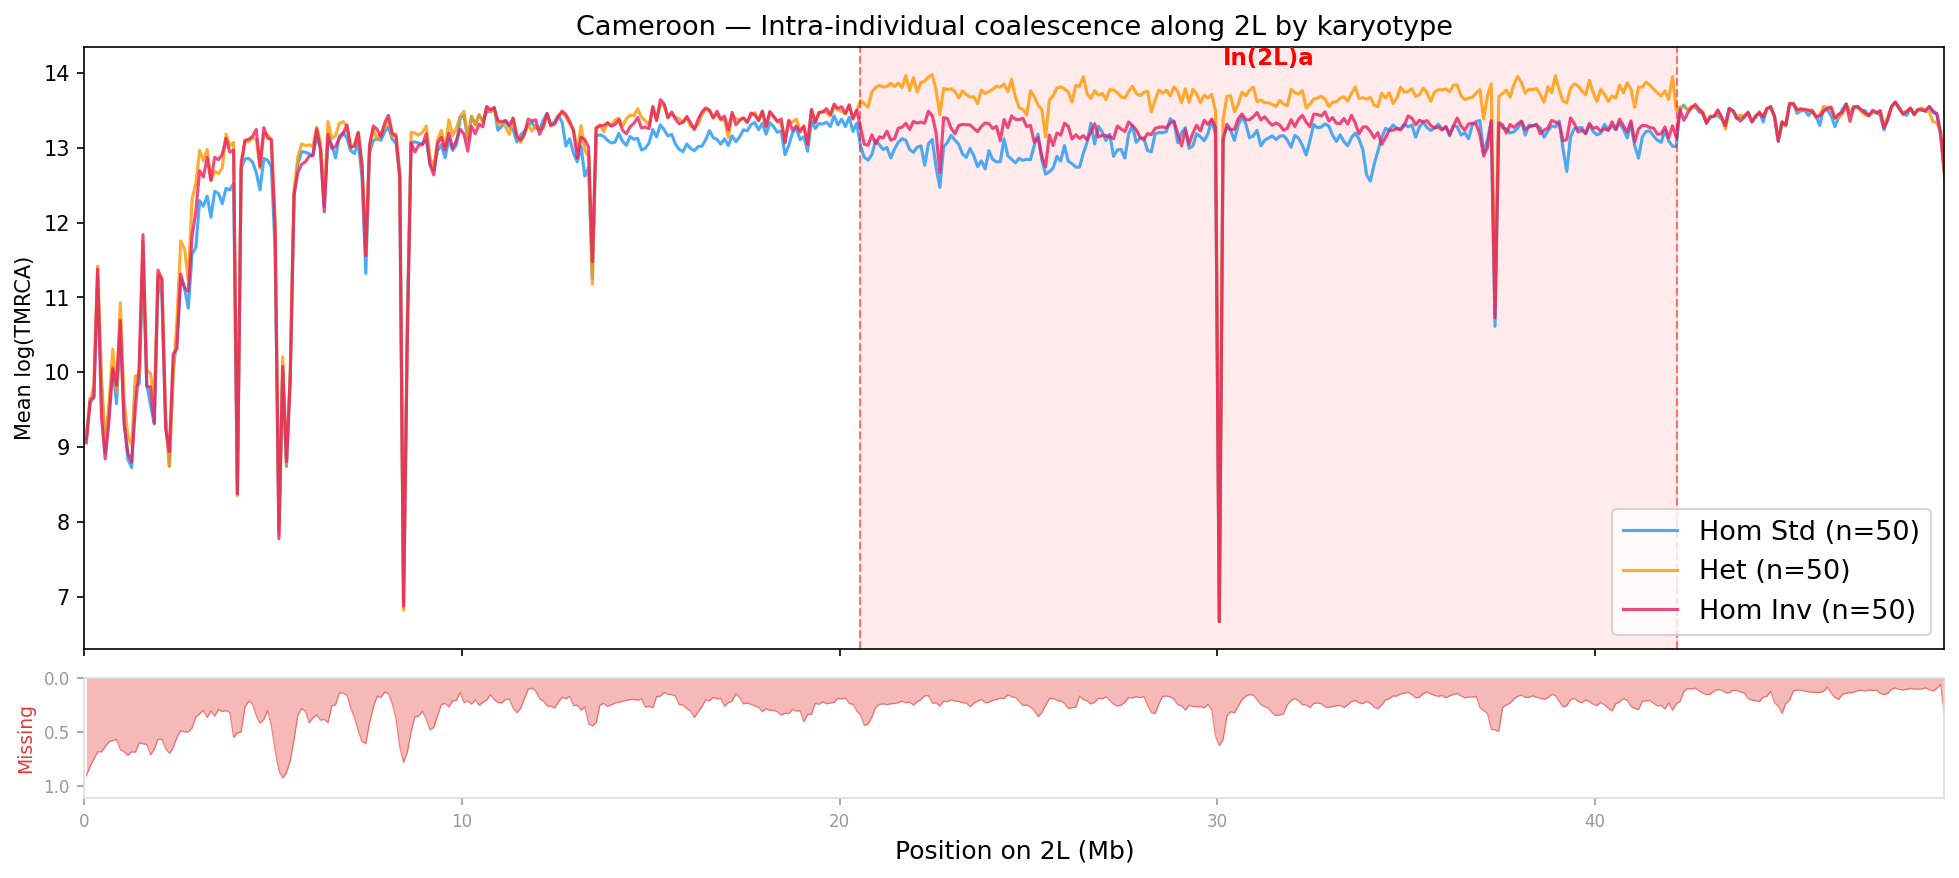
Cameroon — same three karyotype groups. Note similar inversion signature.
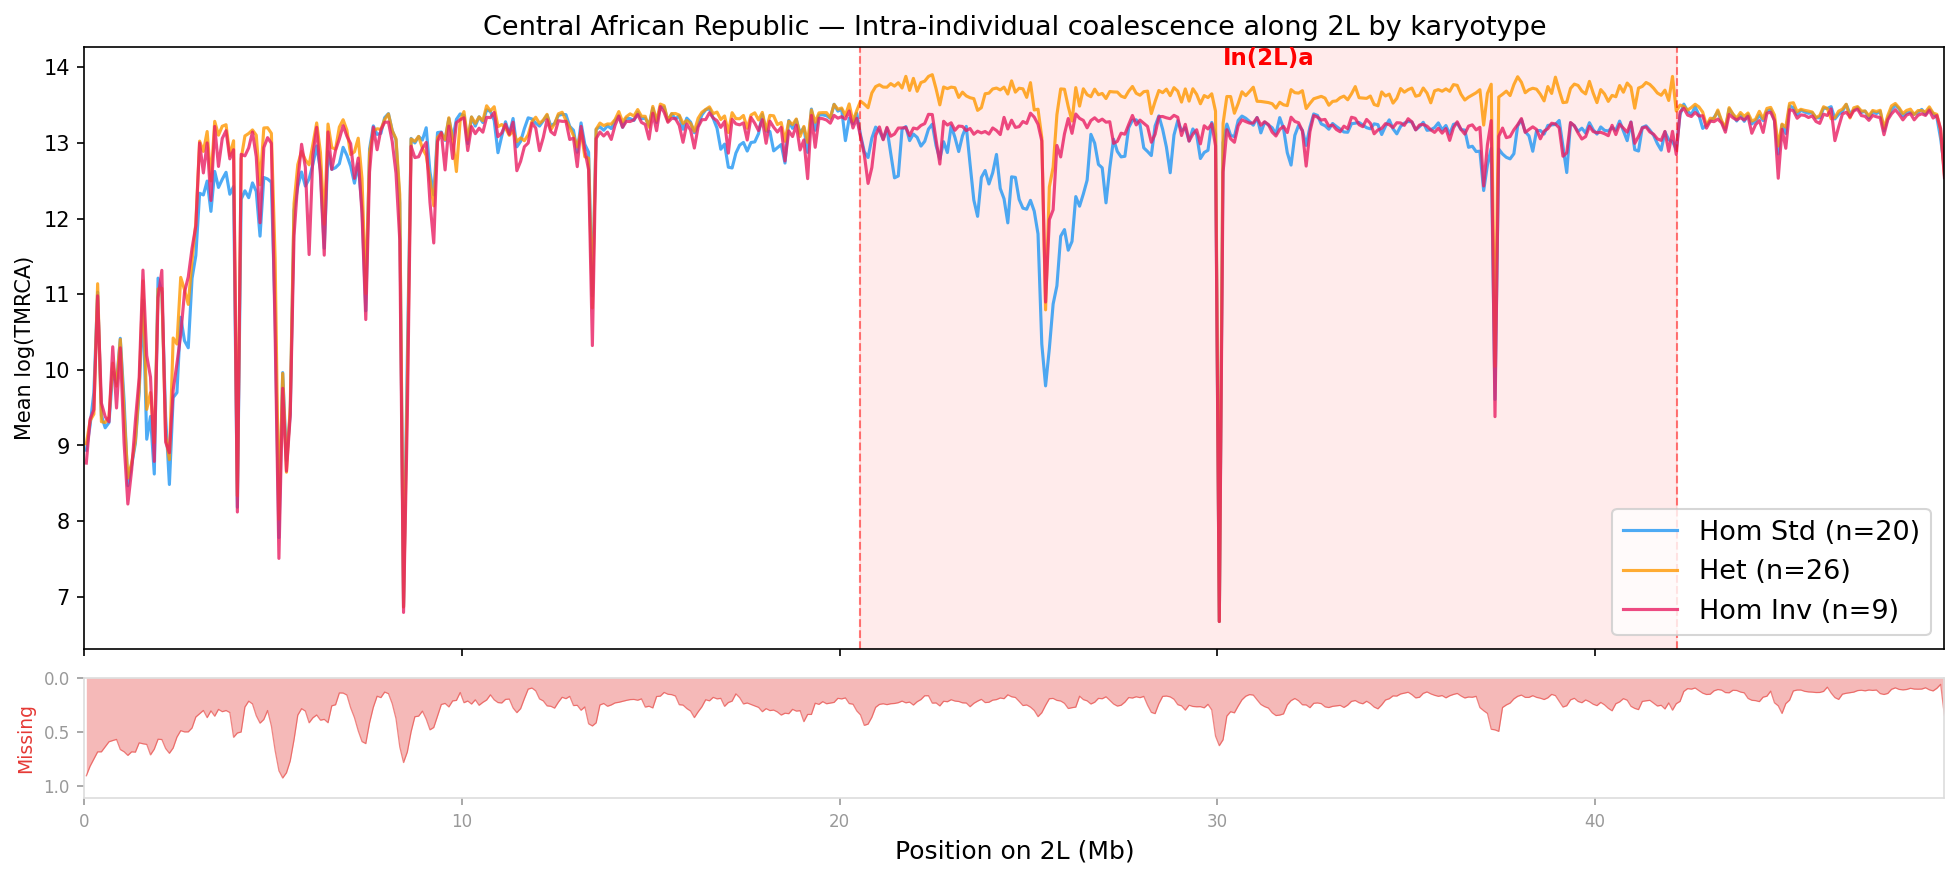
Central African Republic — 2L inversion signal (2L data only, 2R in progress).
Other populations (click to expand)
PENDING — will populate as inference completes for the remaining 13 populations.
Outlier Skylines
Candidate genomic regions with extreme coalescence times, filtered by
accessibility to avoid false positives from missing data. Gene annotations
from VectorBase AgamP4 are overlaid using adjustText for non-overlapping
labels.
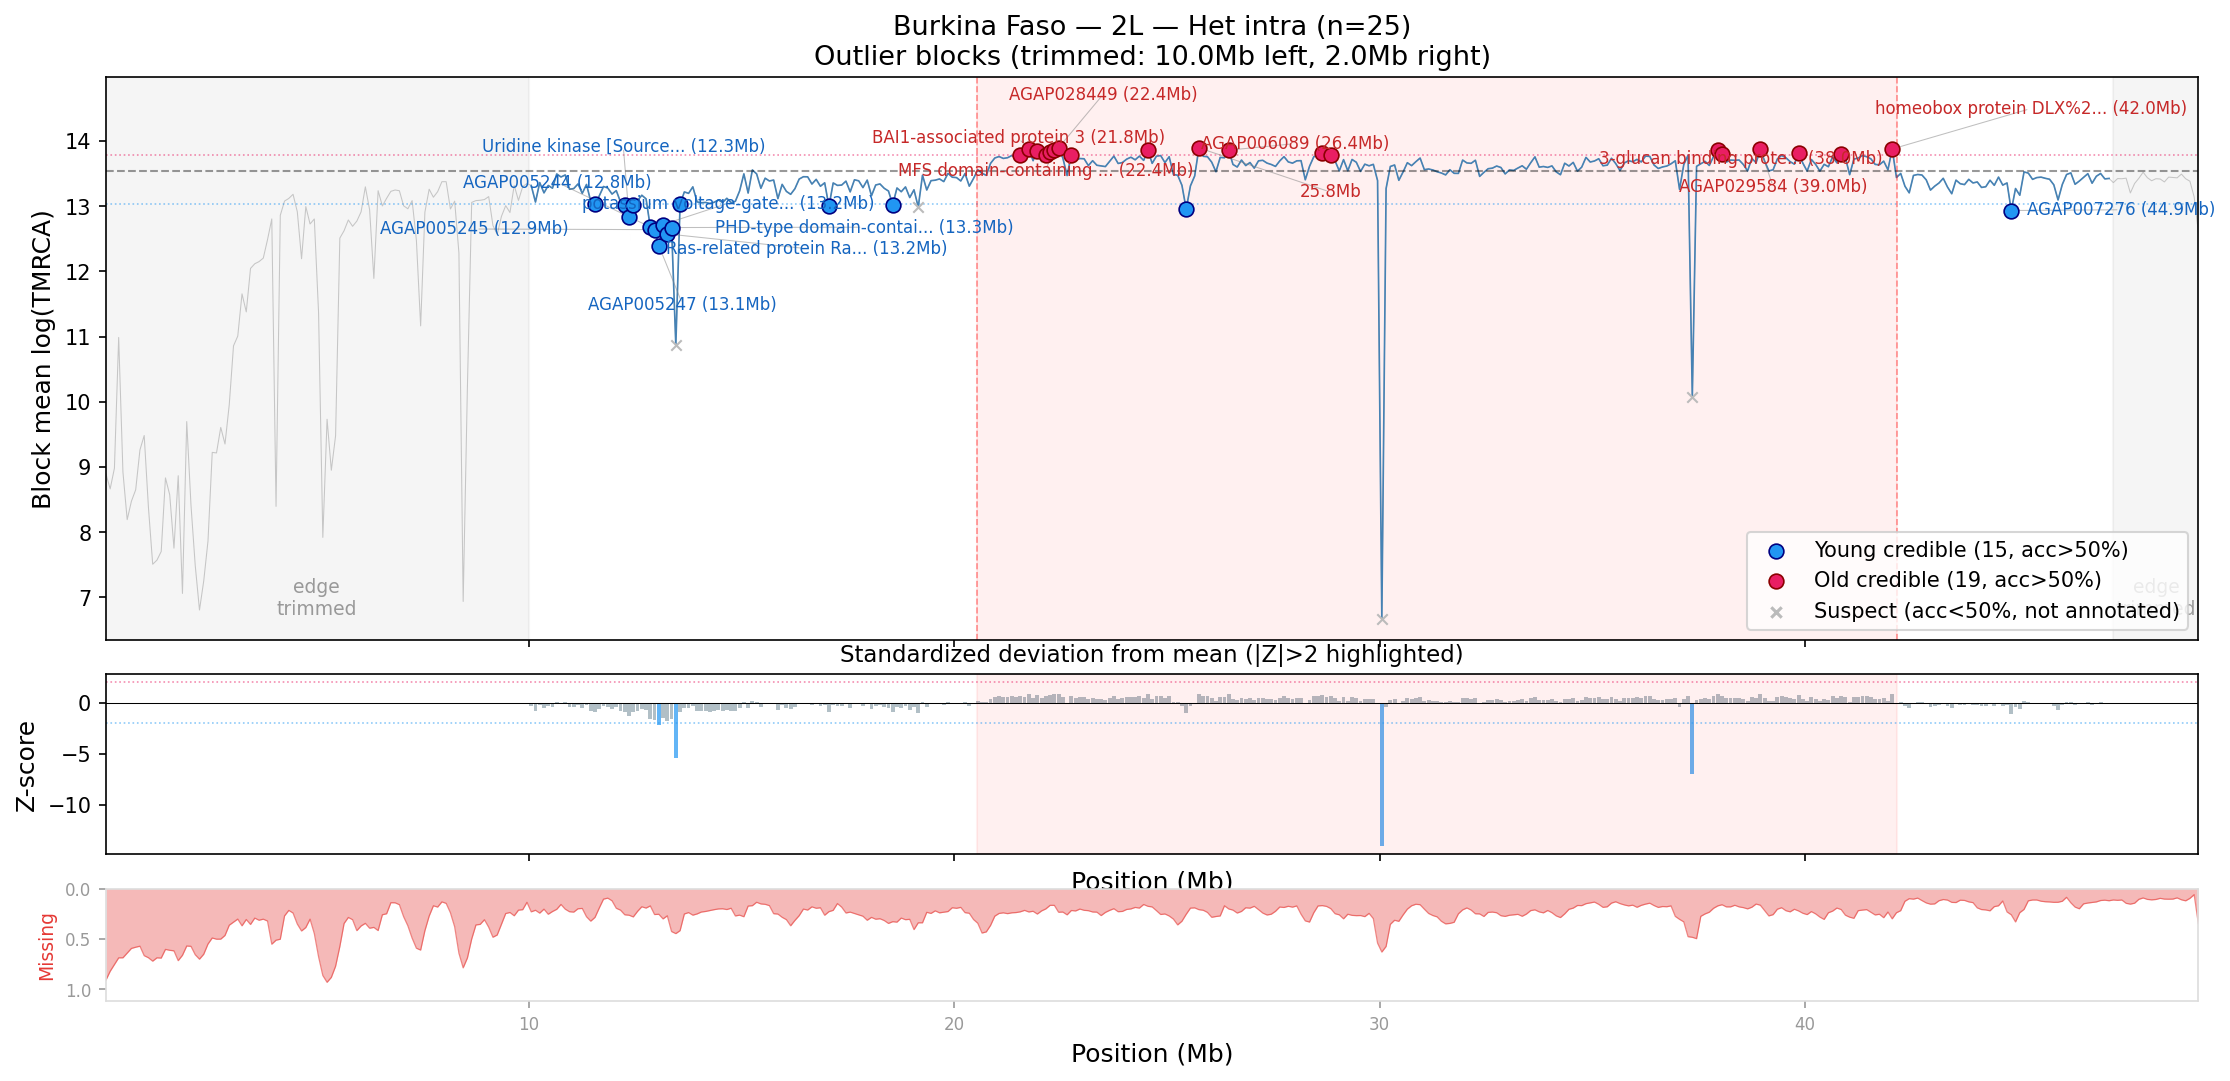
Burkina Faso, 2L, 2La-heterozygous, intra-individual. Blue = young credible outliers (accessible regions only), red = old credible, gray x = suspect (low accessibility). Bottom panels: Z-score and accessibility fraction.
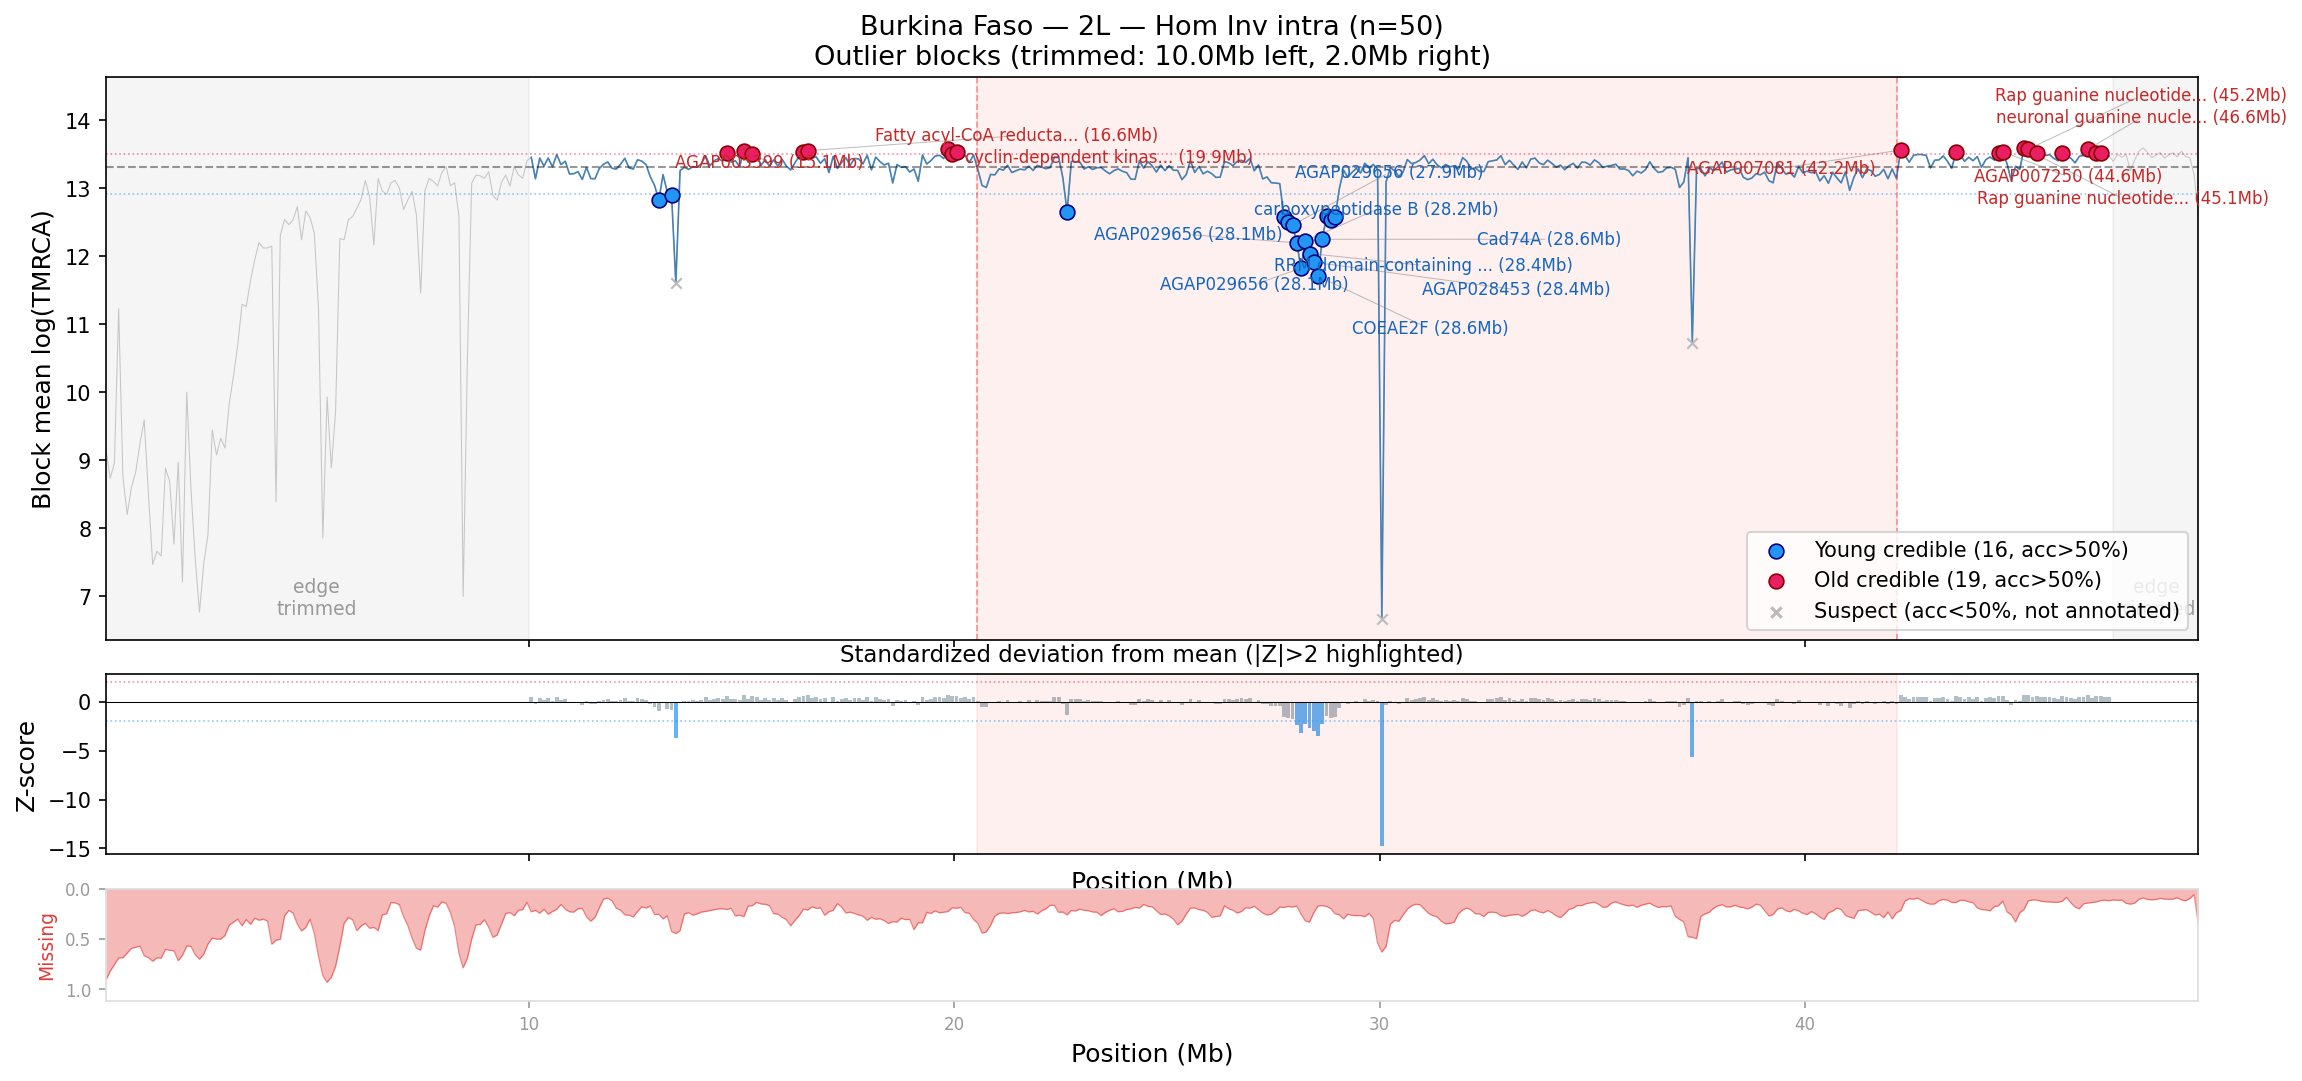
Same for homozygous inverted. Note the deep dip near Rdl (28.5 Mb) and CDSB21 — potential selection signatures within the inverted arrangement.
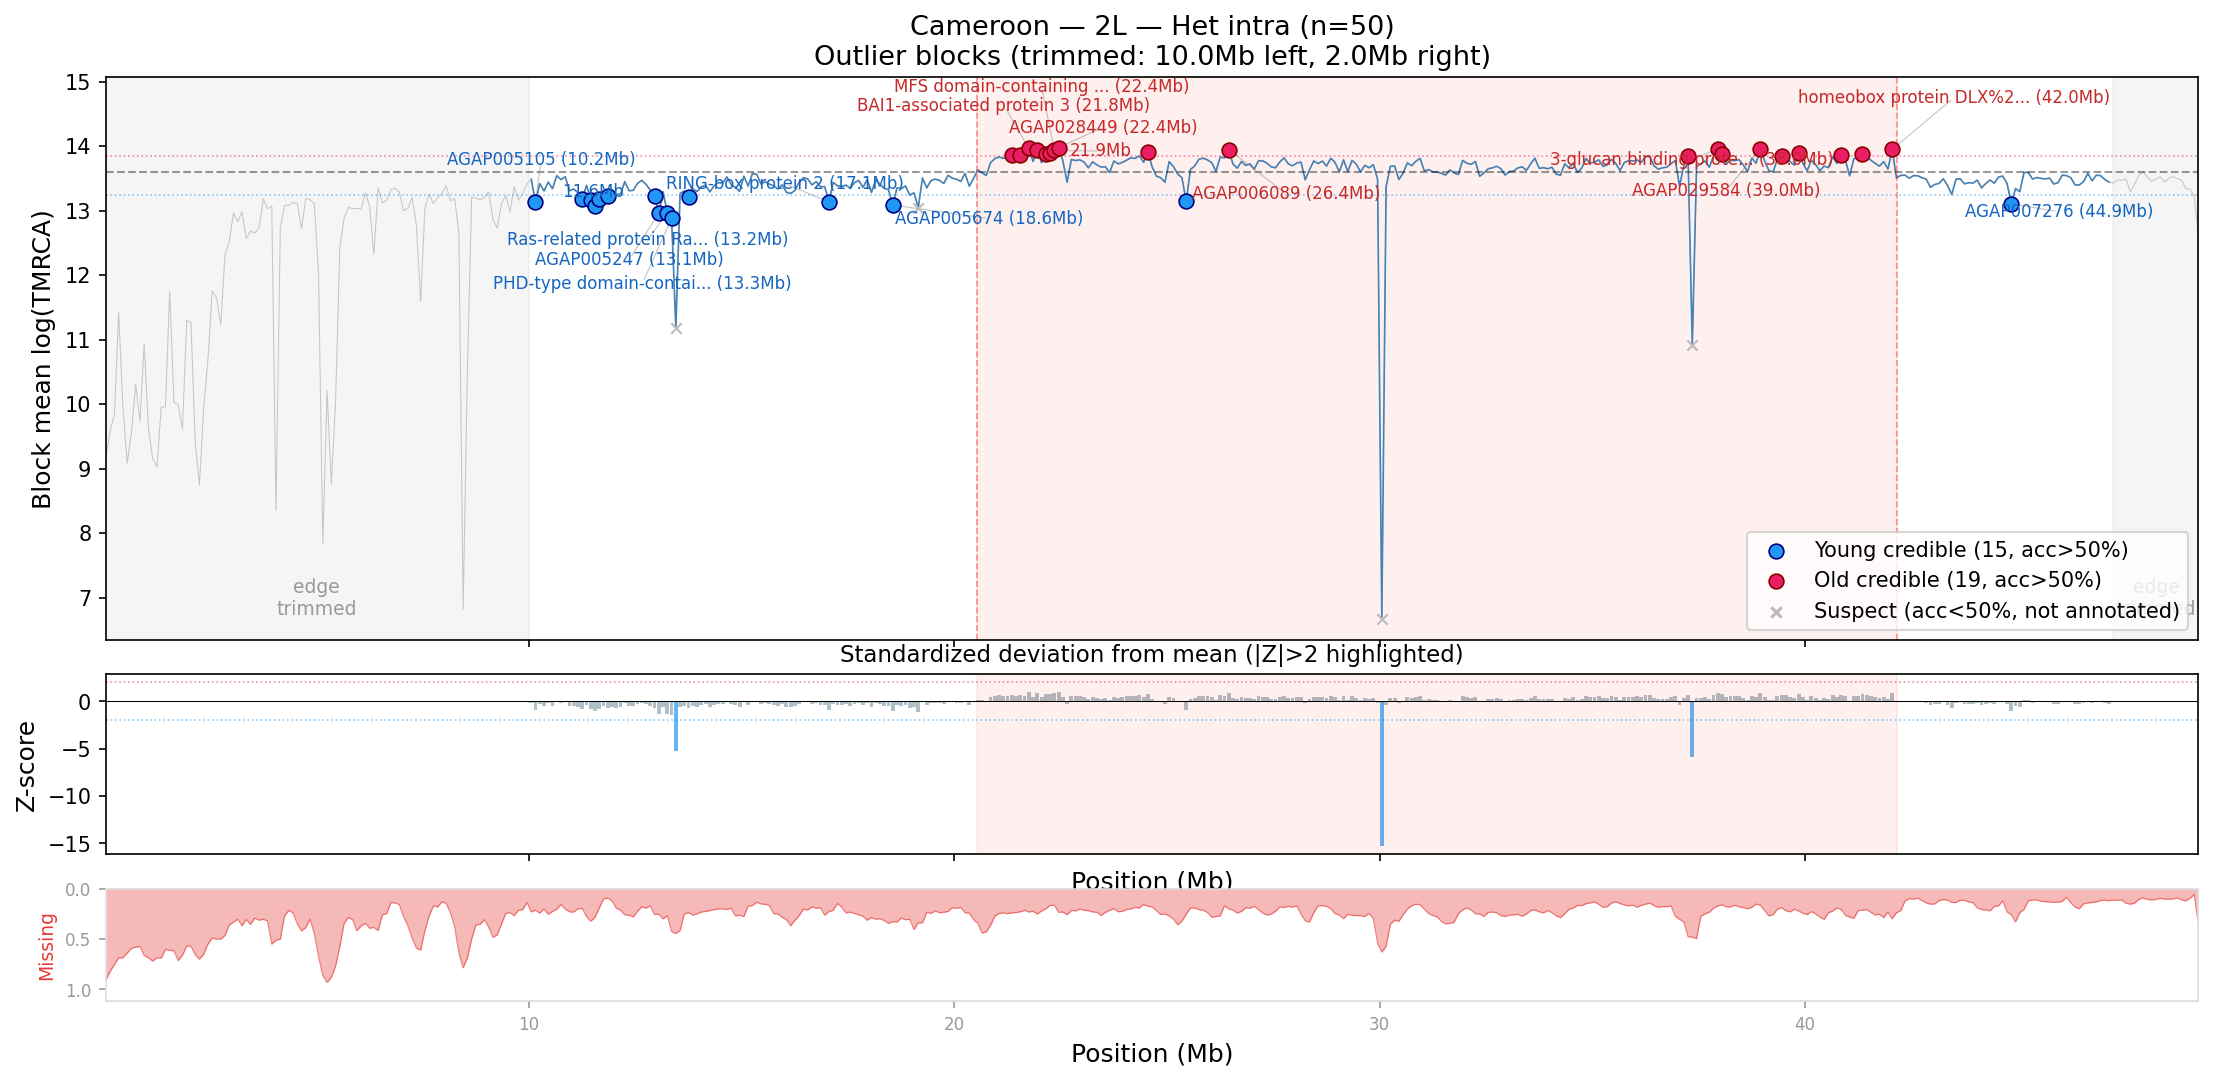
Cameroon, 2L, 2La-heterozygous, intra-individual.
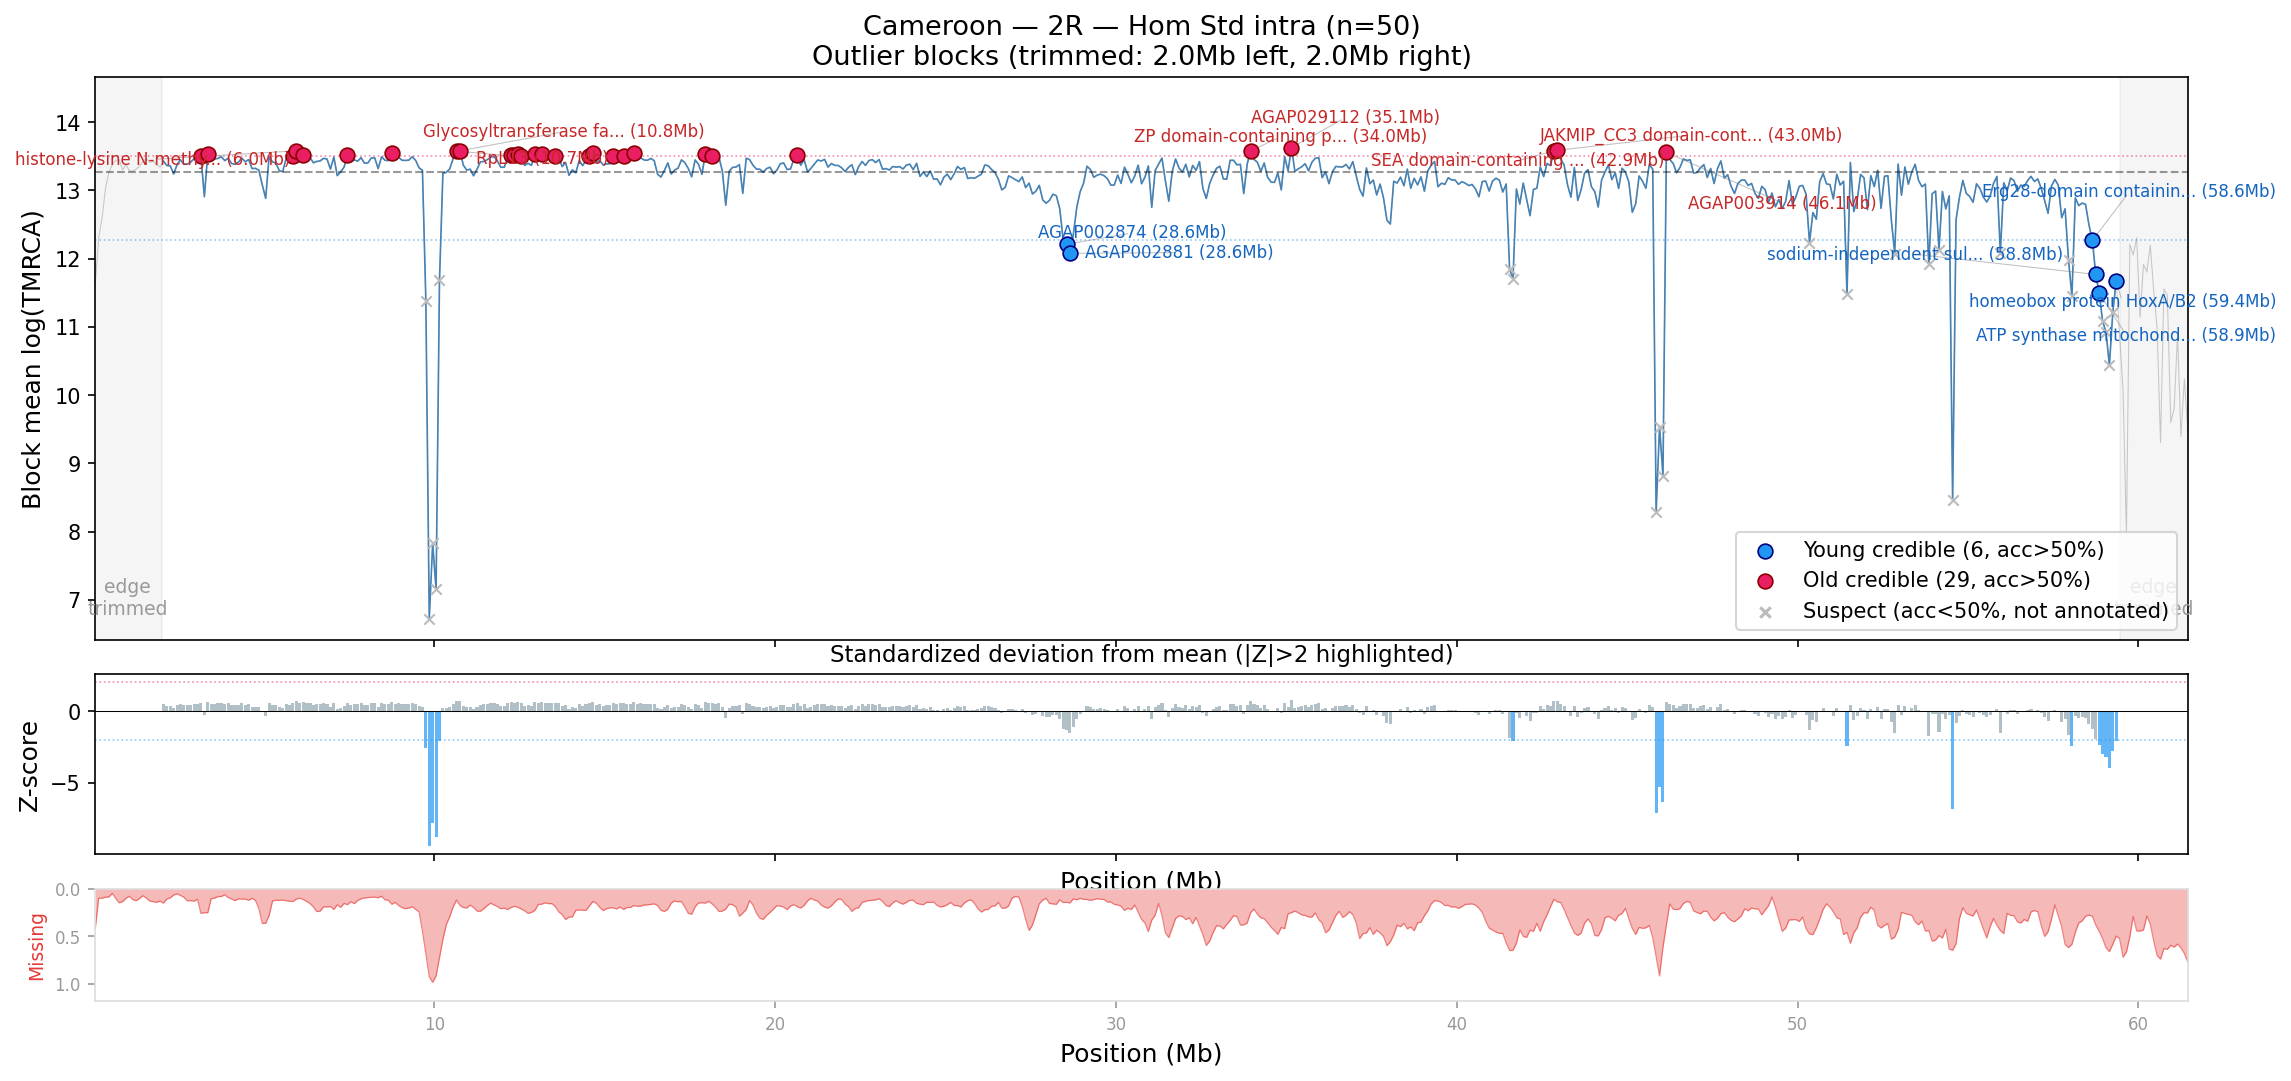
Cameroon, 2R, 2Rb-hom-standard, intra-individual.
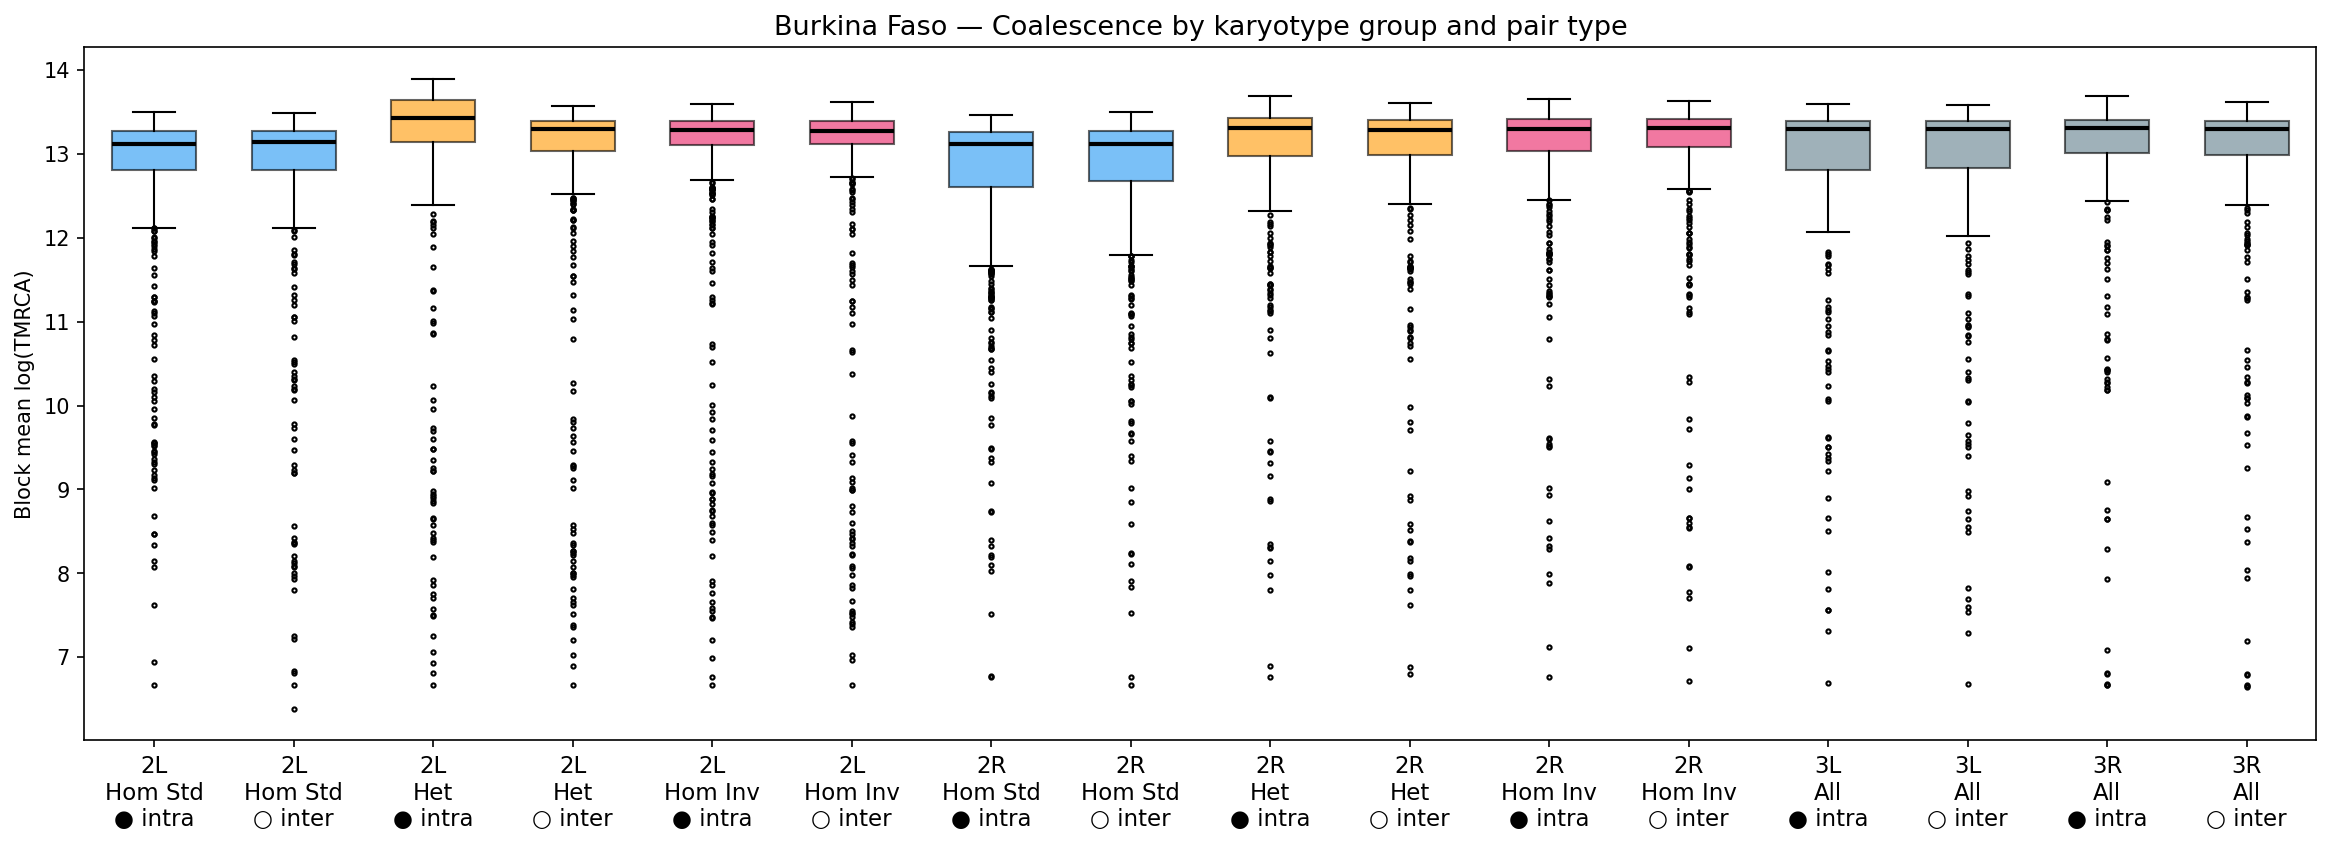
Karyotype Comparisons
Box plots comparing block-level coalescence distributions across karyotype groups and pair types. Heterozygous intra pairs show elevated TMRCA on inversion-bearing chromosomes (2L, 2R), while 3L/3R show uniform patterns.
Chromosome-Wide Profiles
TMRCA profiles across all chromosome arms with per-arm accessibility tracks.
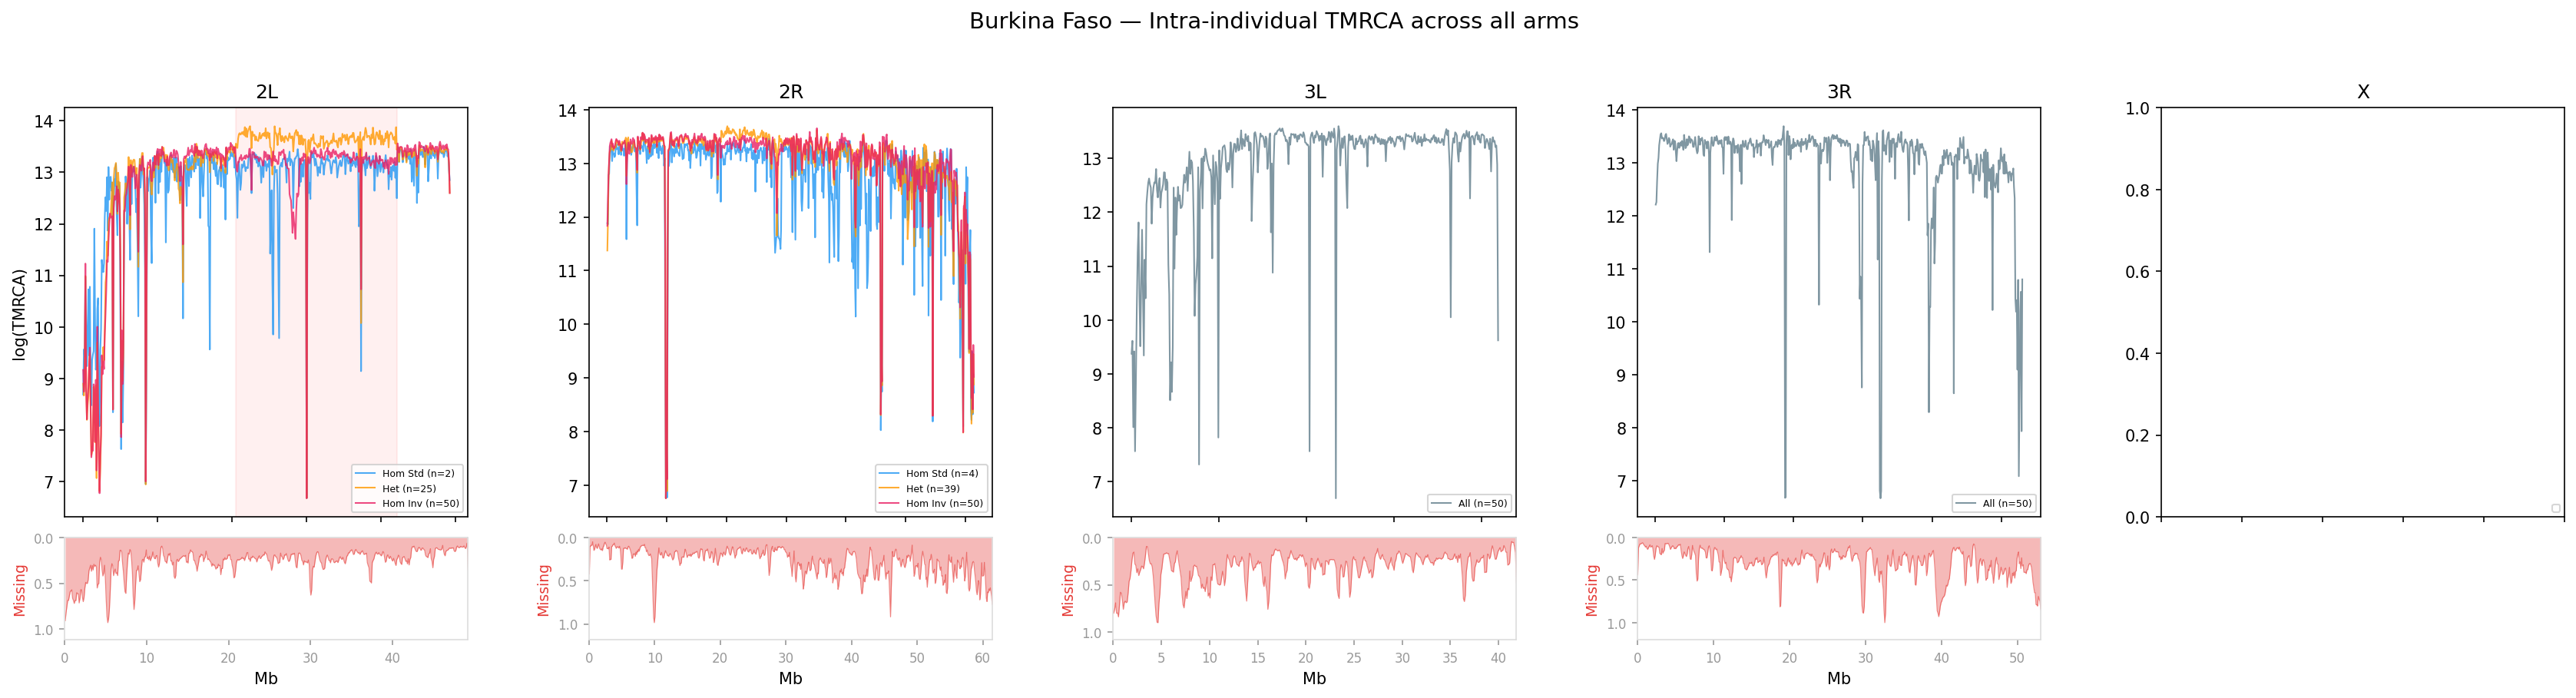
Each column is one chromosome arm (2L, 2R, 3L, 3R, X). Karyotype groups overlaid by color. Red shading on 2L marks In(2L)a.
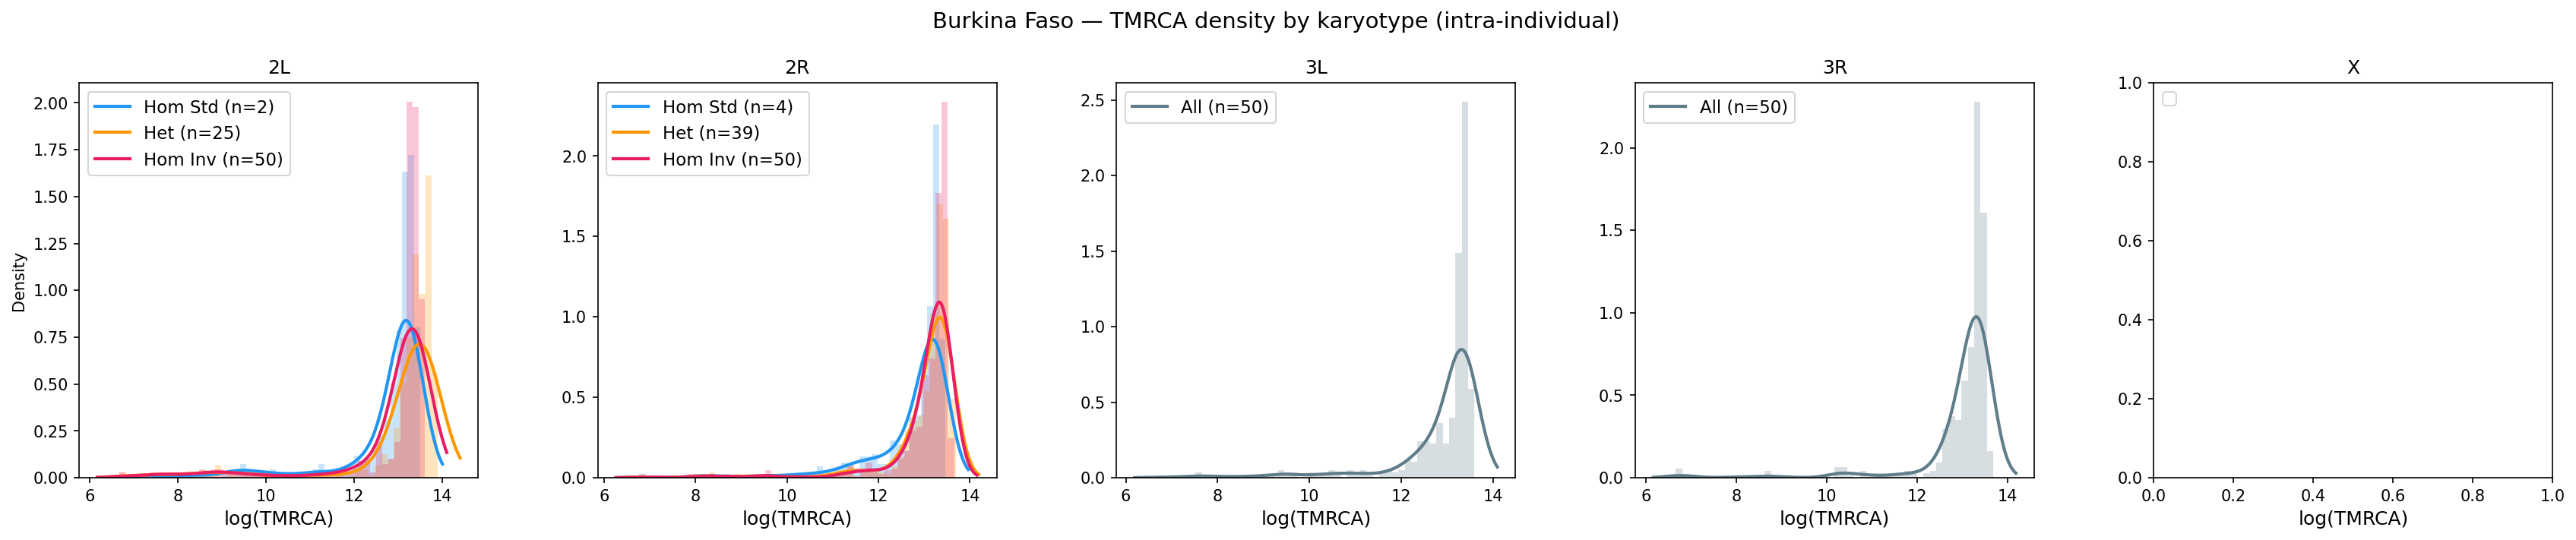
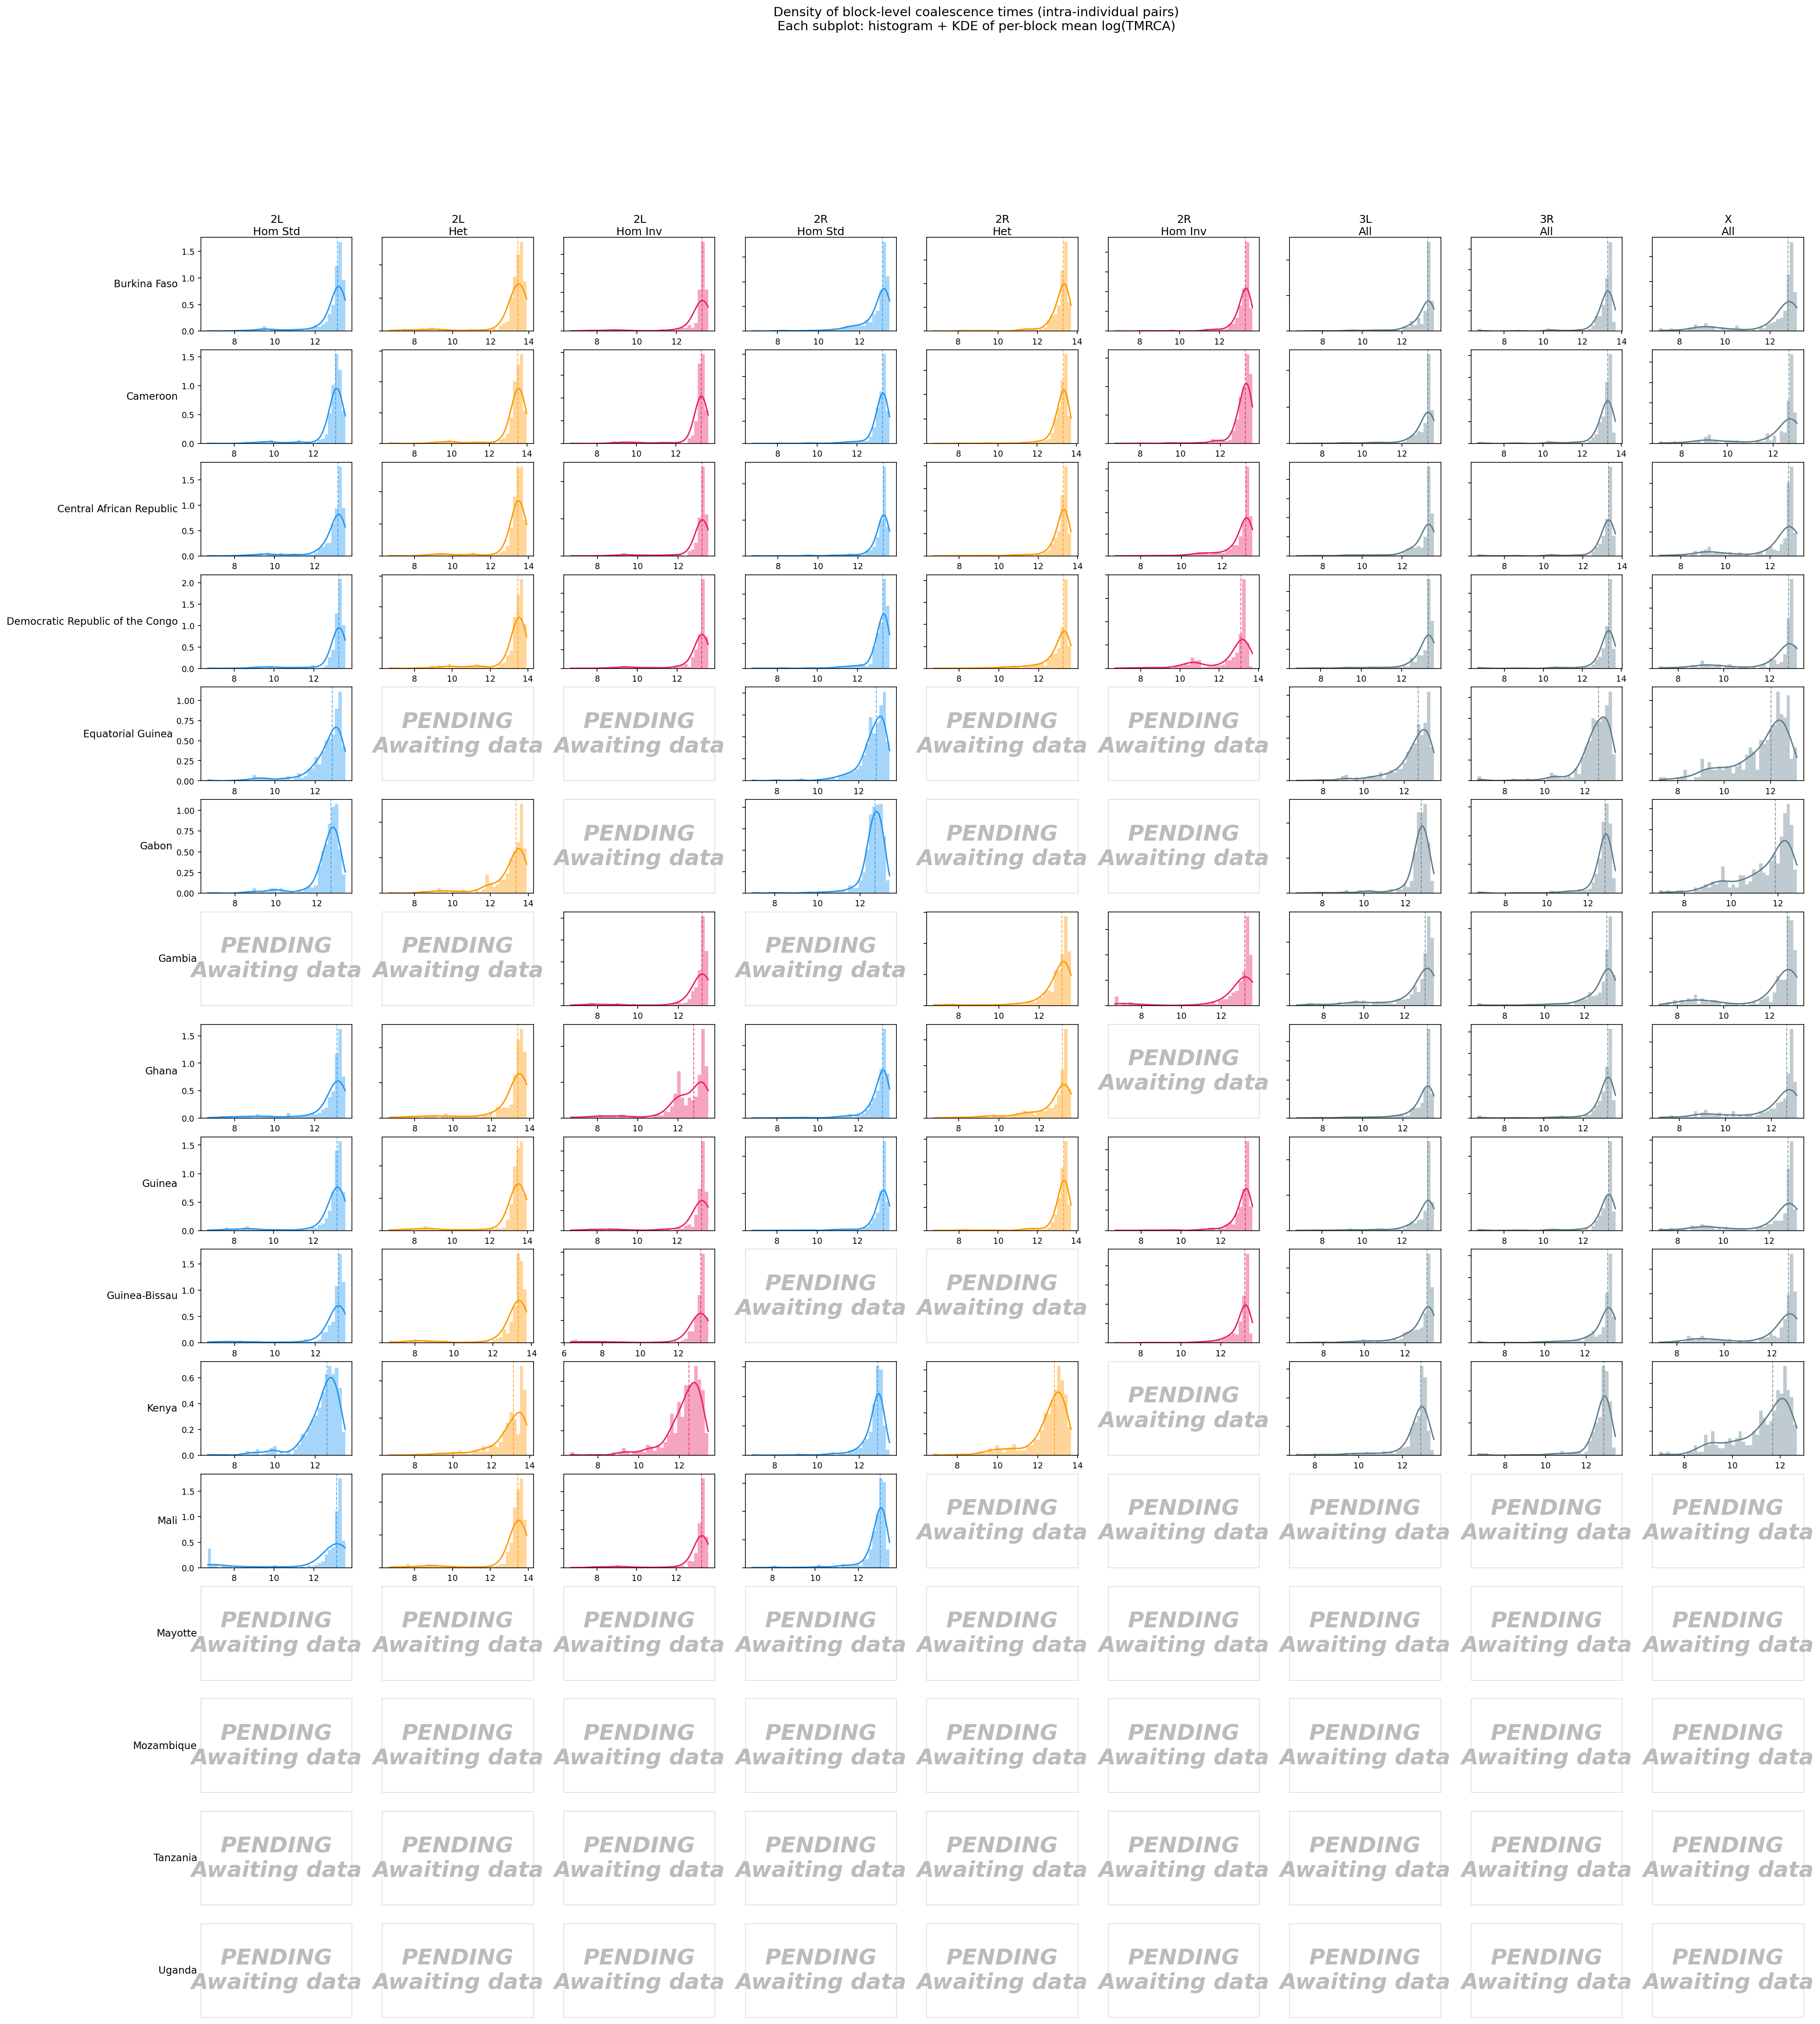
Density Distributions
KDE density overlays showing the distribution of block-level coalescence times per karyotype group for each arm.
Demographic Inference
Inverse instantaneous coalescence rates (IICR), a proxy for effective
population size Ne(t), estimated from the TMRCA distribution and compared
to the stdpopsim A. gambiae Gabon reference model (GabonAg1000G_1A17).
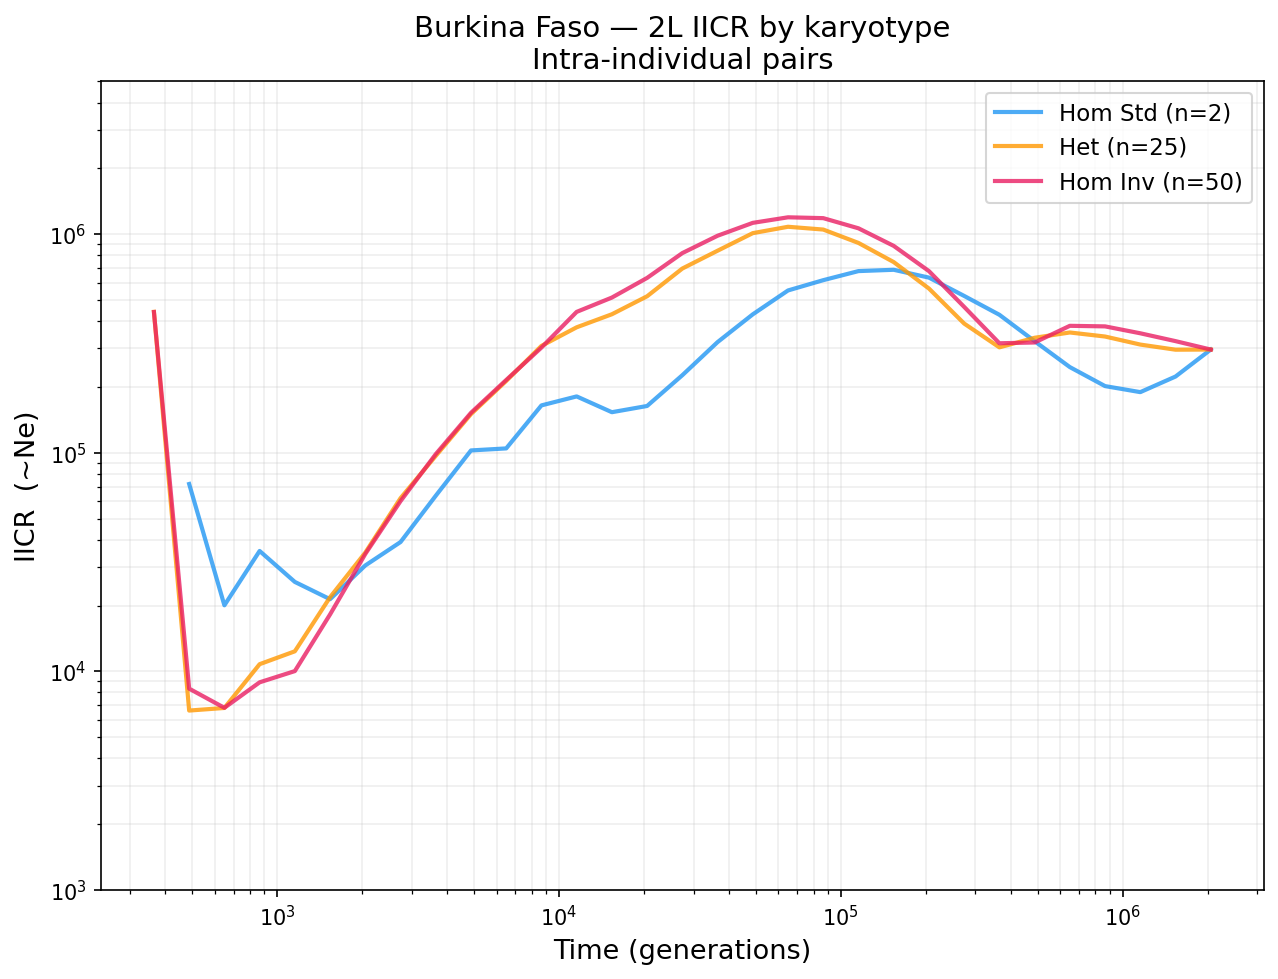
Burkina Faso 2L: IICR by karyotype. The heterozygous curve (orange) is inflated at intermediate times due to deep coalescence inside the inversion. Dashed black = stdpopsim Gabon reference.
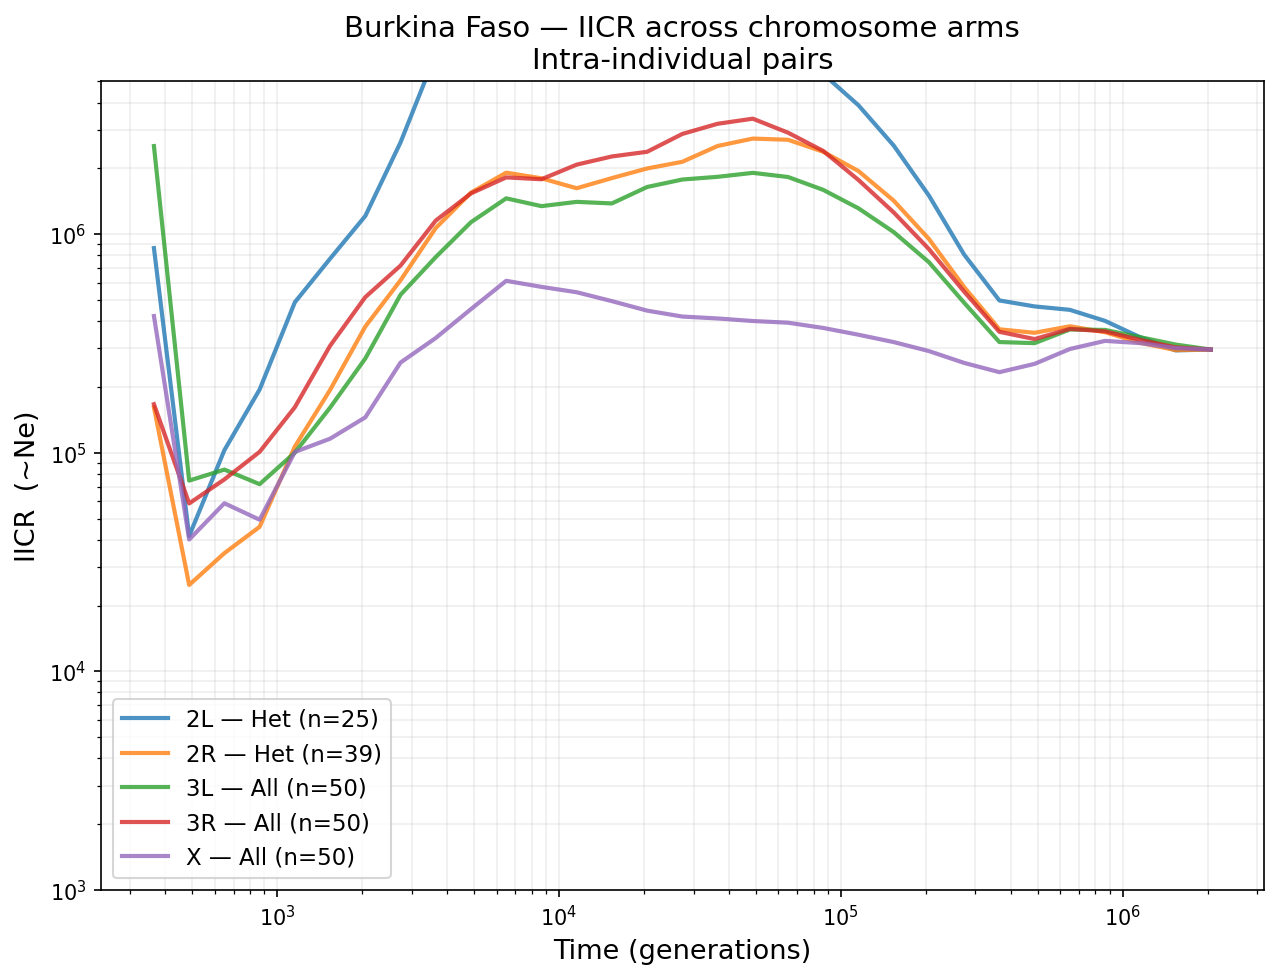
All chromosome arms overlaid. 3L and 3R (no inversions) track the stdpopsim reference more closely, providing a cleaner demographic signal.
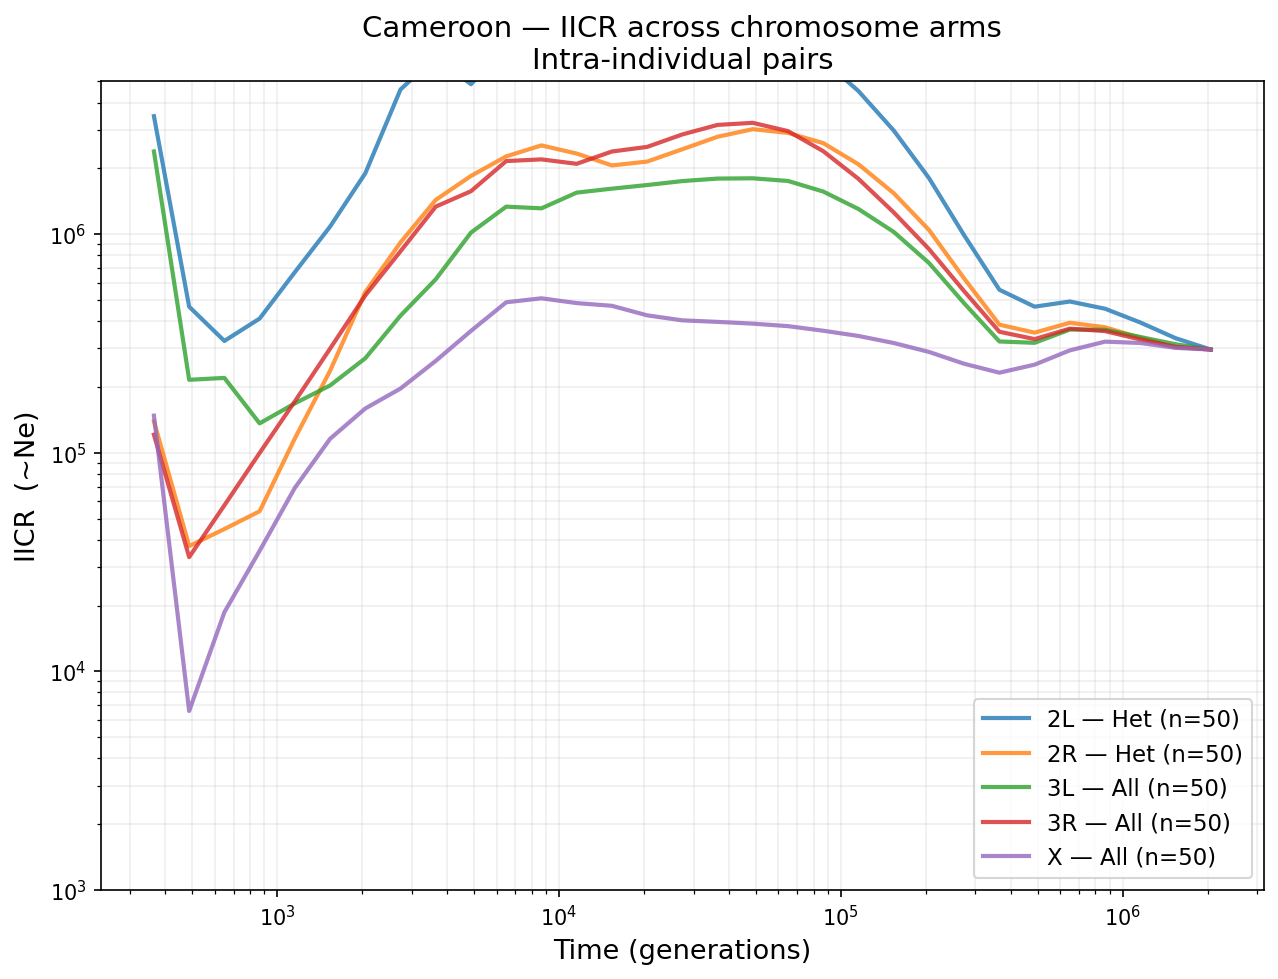
Cameroon — all chromosome arms overlaid.
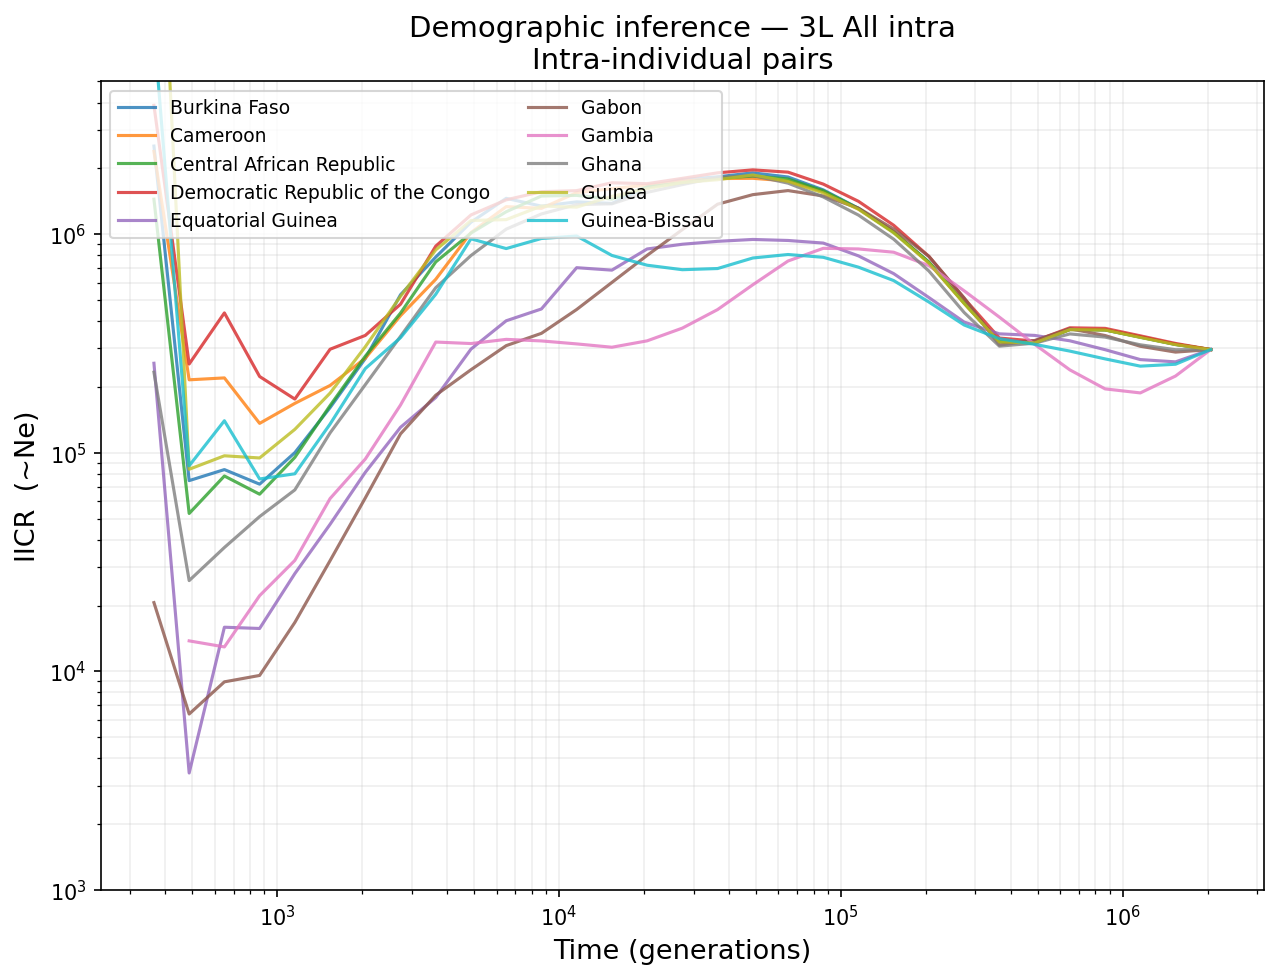
Cross-population IICR comparison on 3L (no inversions) — 9 completed populations overlaid.
Geographic Maps
Coalescence patterns projected onto Africa using population coordinates from the Ag3 metadata.
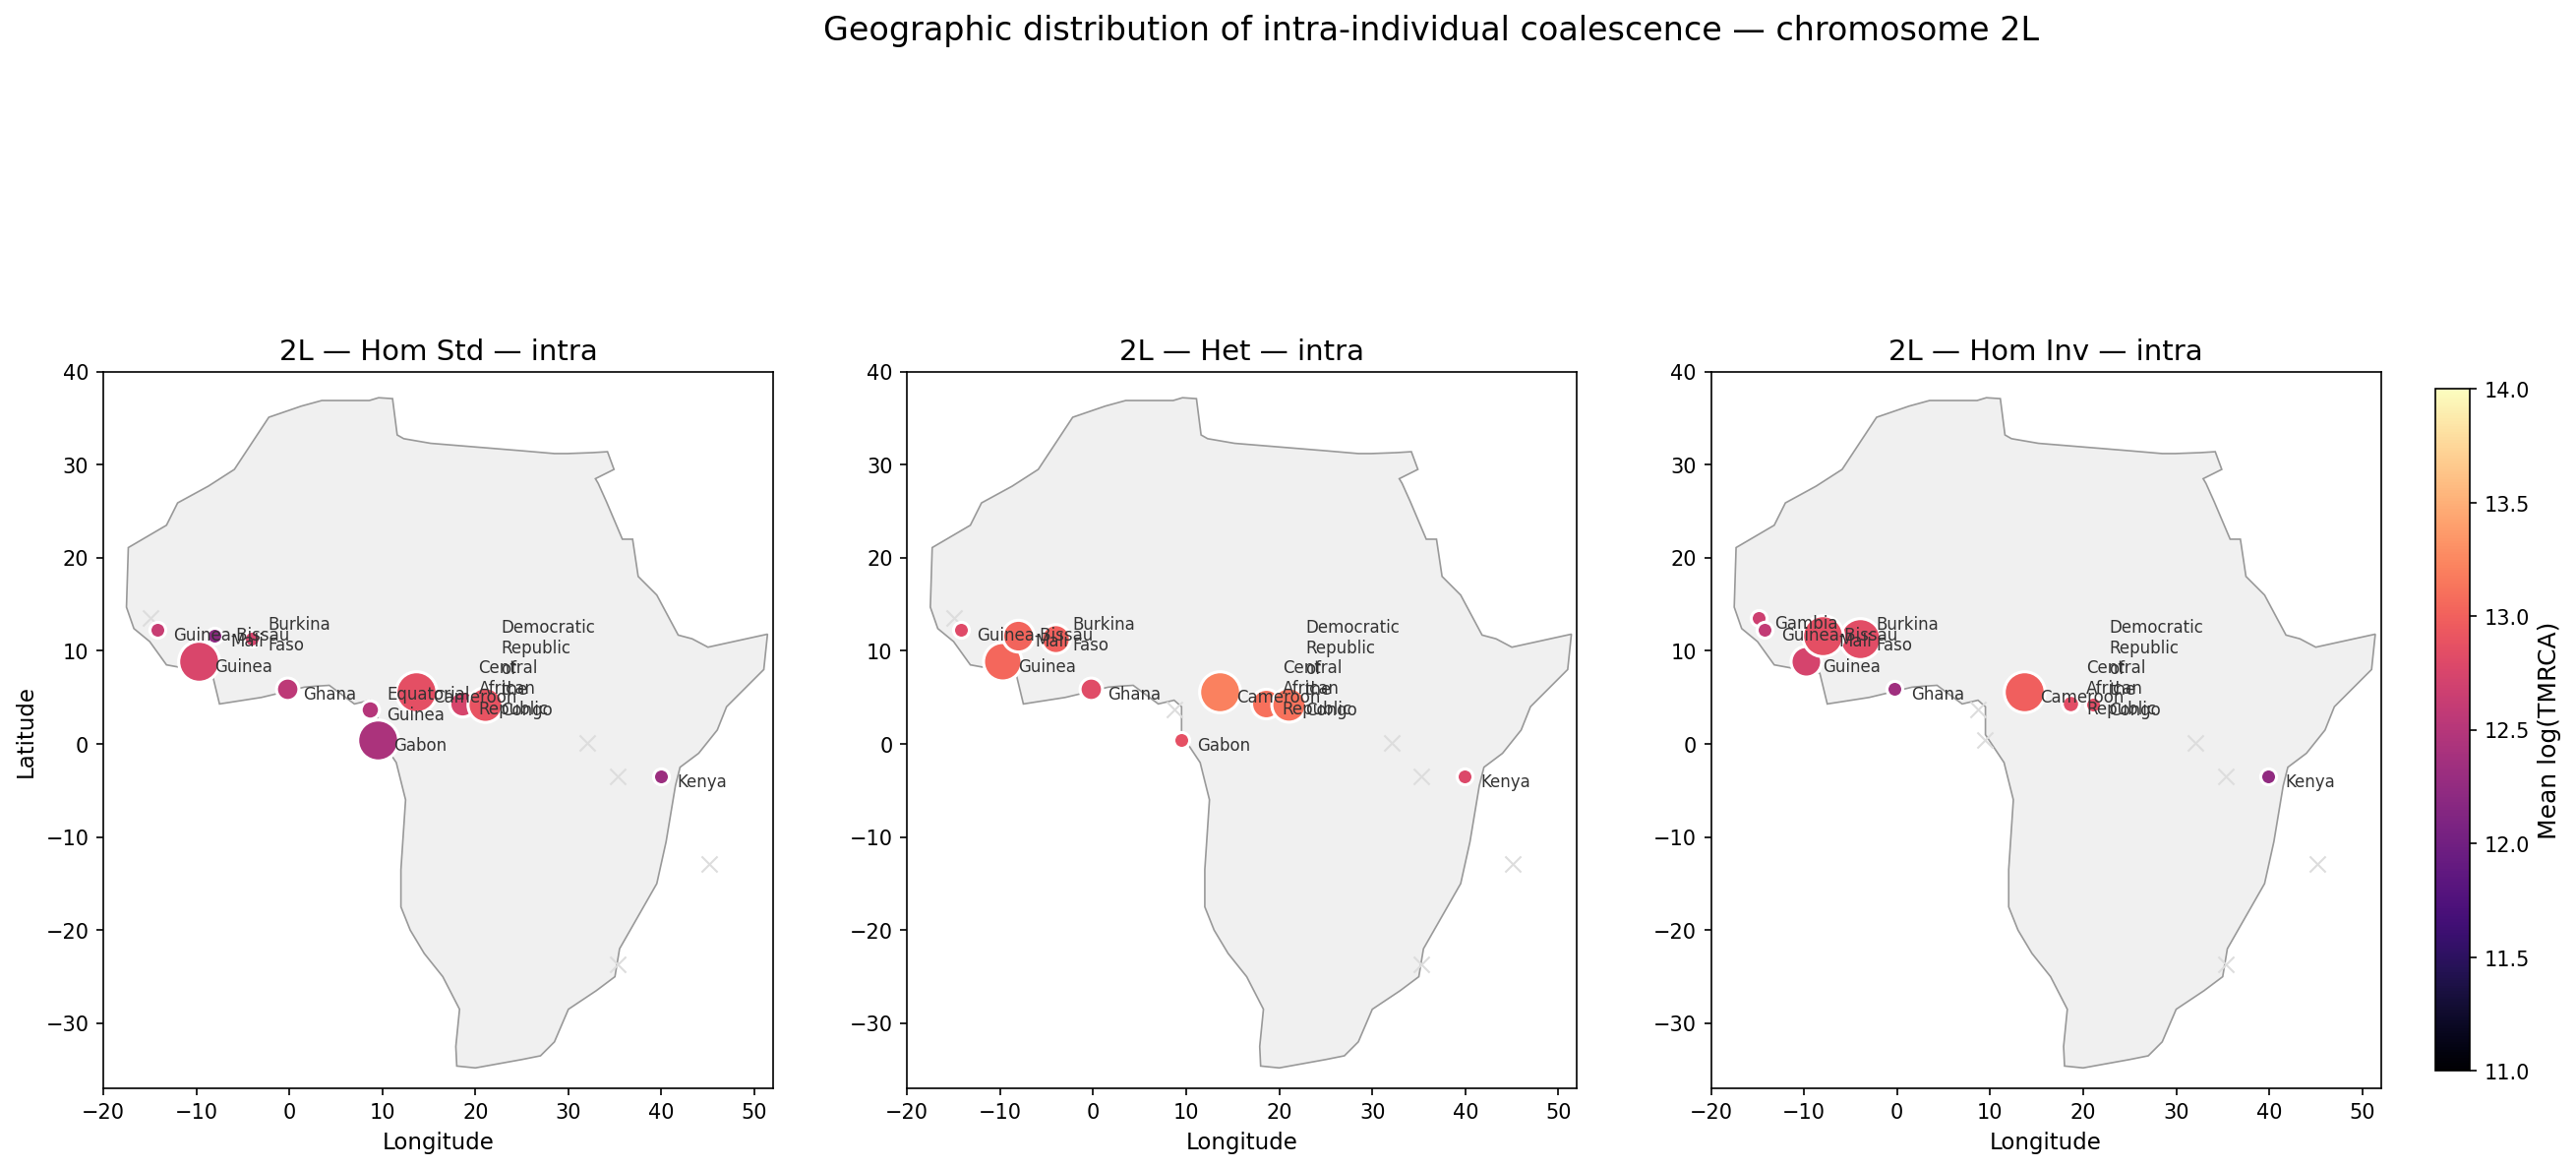
Bubble size = sample count, color = mean log-TMRCA. Three panels for hom standard, heterozygous, and hom inverted karyotypes on 2L.
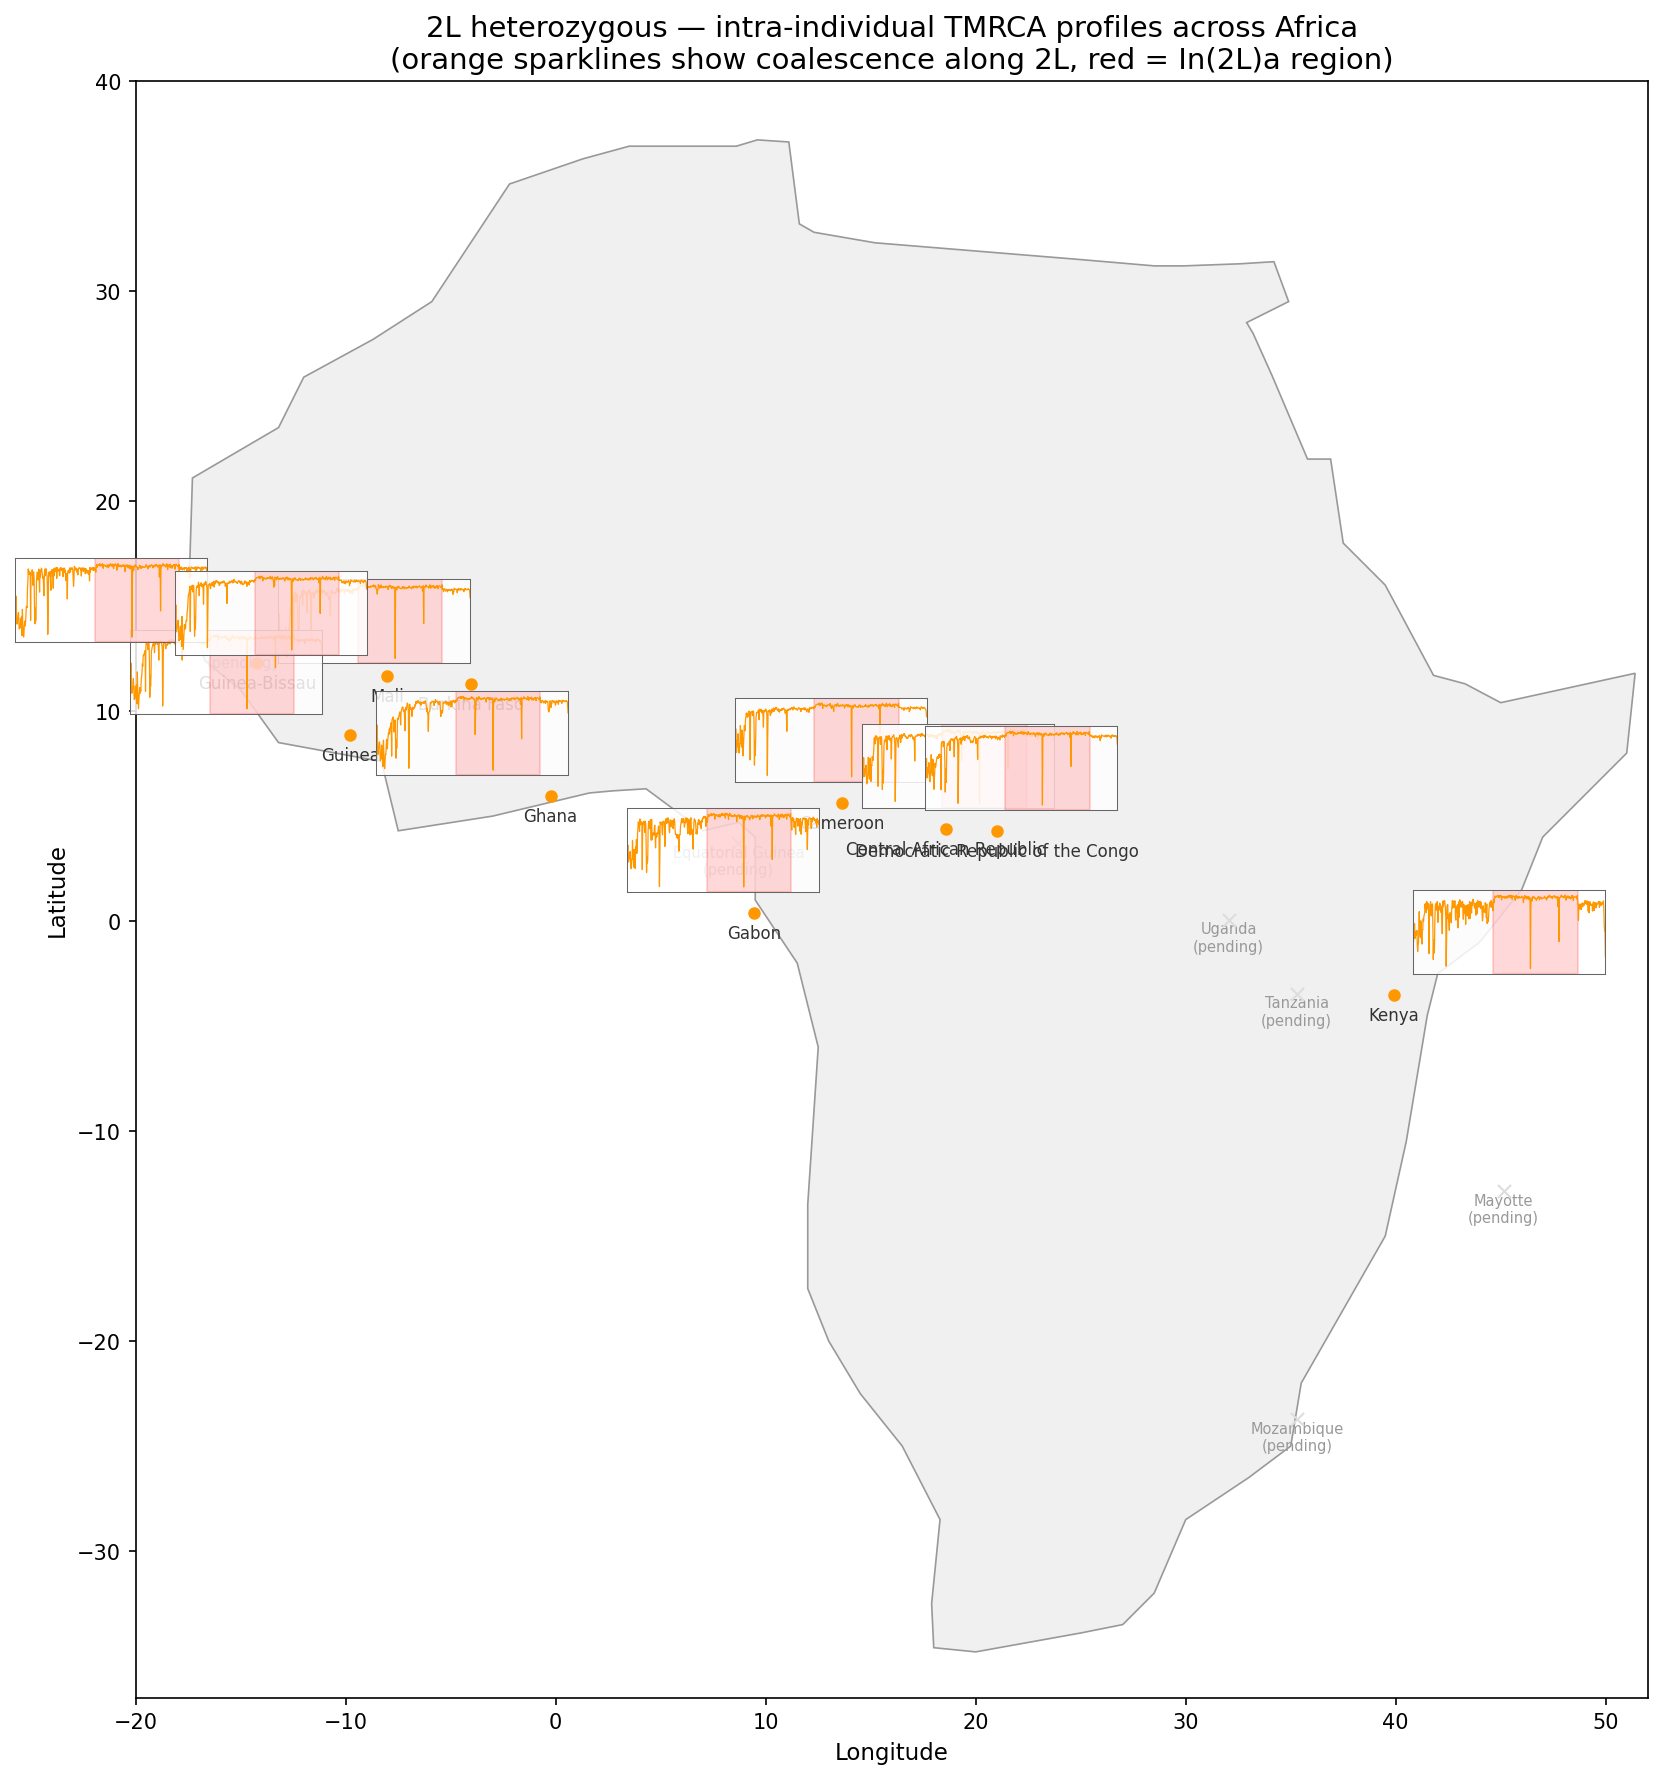
TMRCA profiles embedded as sparklines at each population’s location. Orange lines show coalescence along 2L, red shading = In(2L)a region.
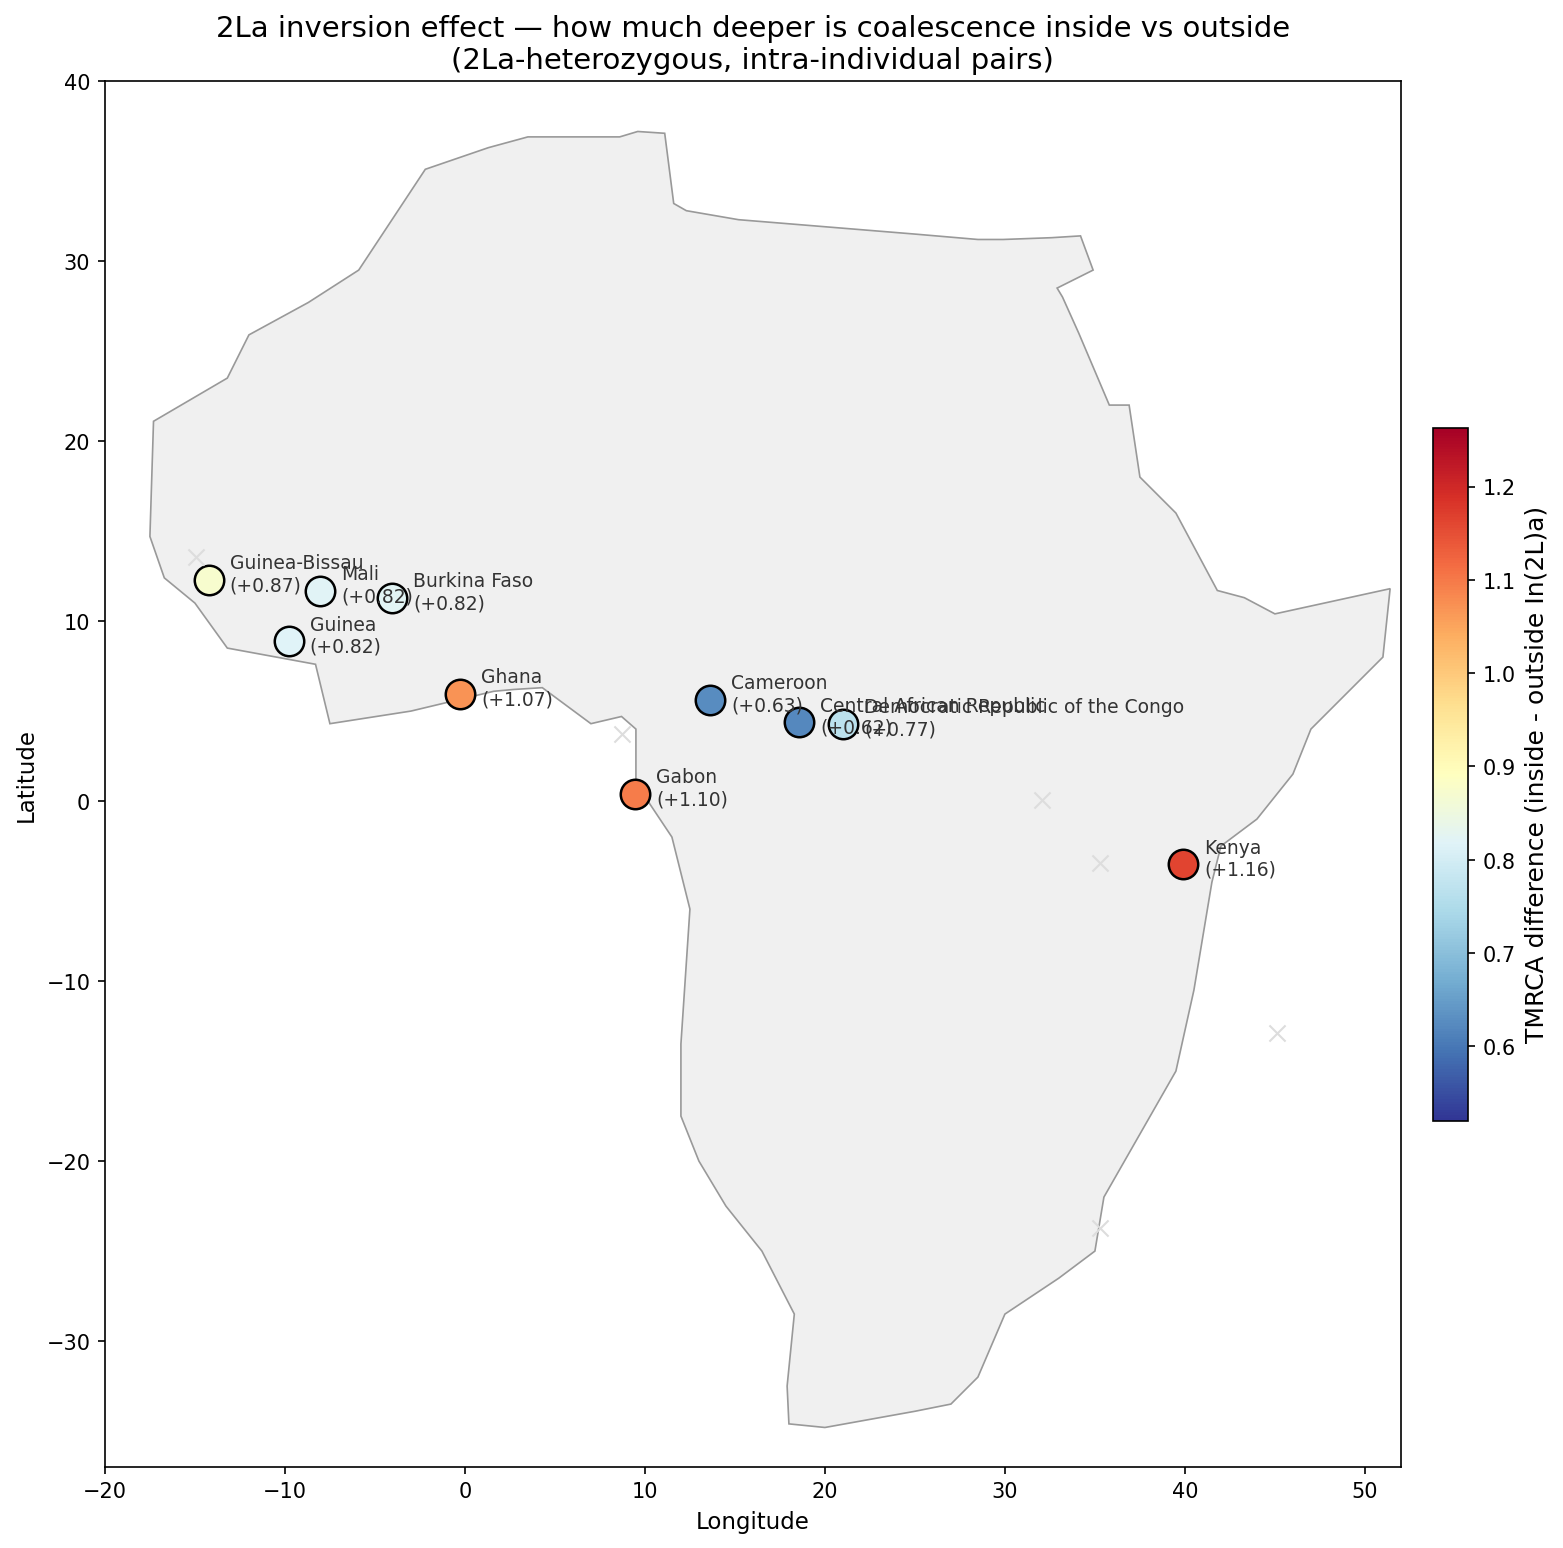
How much deeper is coalescence inside vs outside In(2L)a for each population. Positive values = inversion creates deeper coalescence.
Population Structure
PCA and clustering of populations based on their coalescence profiles across all chromosome arms and karyotype groups.
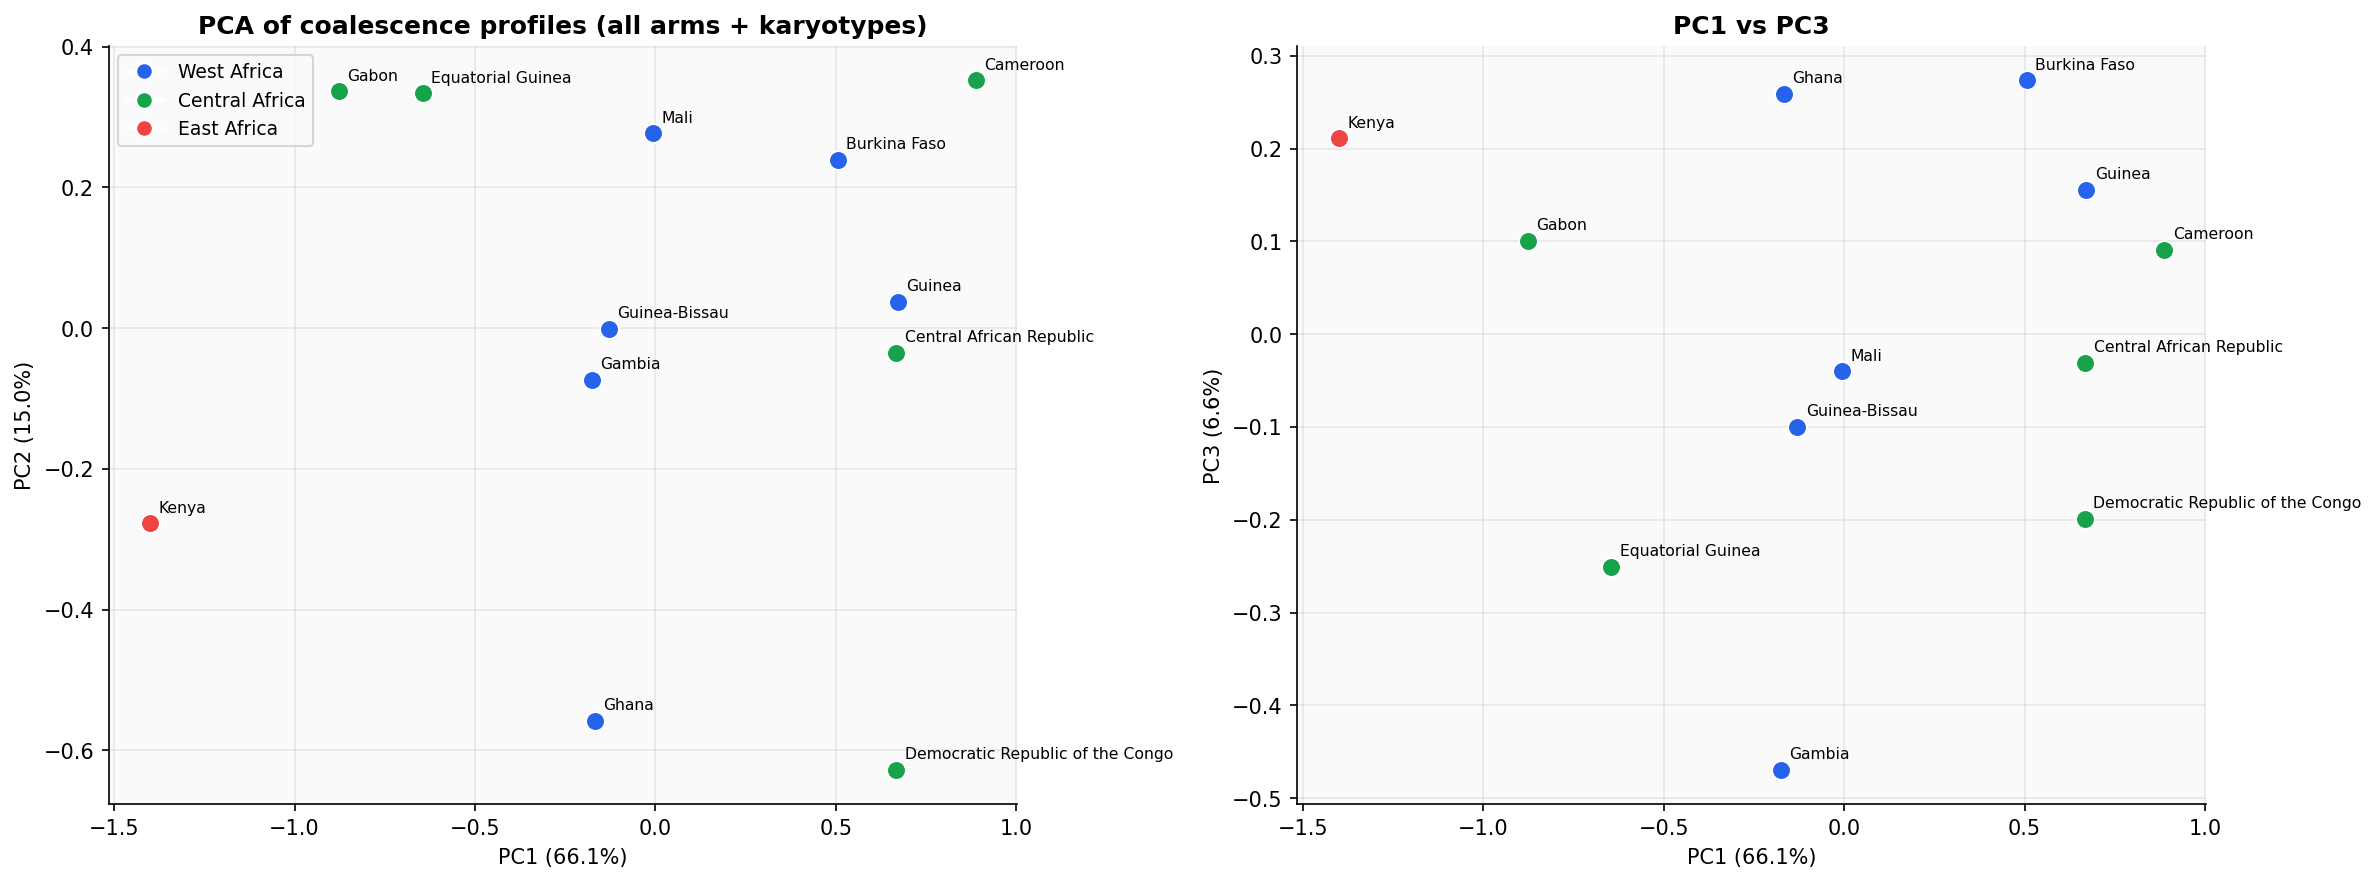
PCA on all features (arms x karyotype groups x pair types). PC1 (66%) separates East Africa (Kenya) from West/Central. Blue = West, purple = Central, red = East Africa.
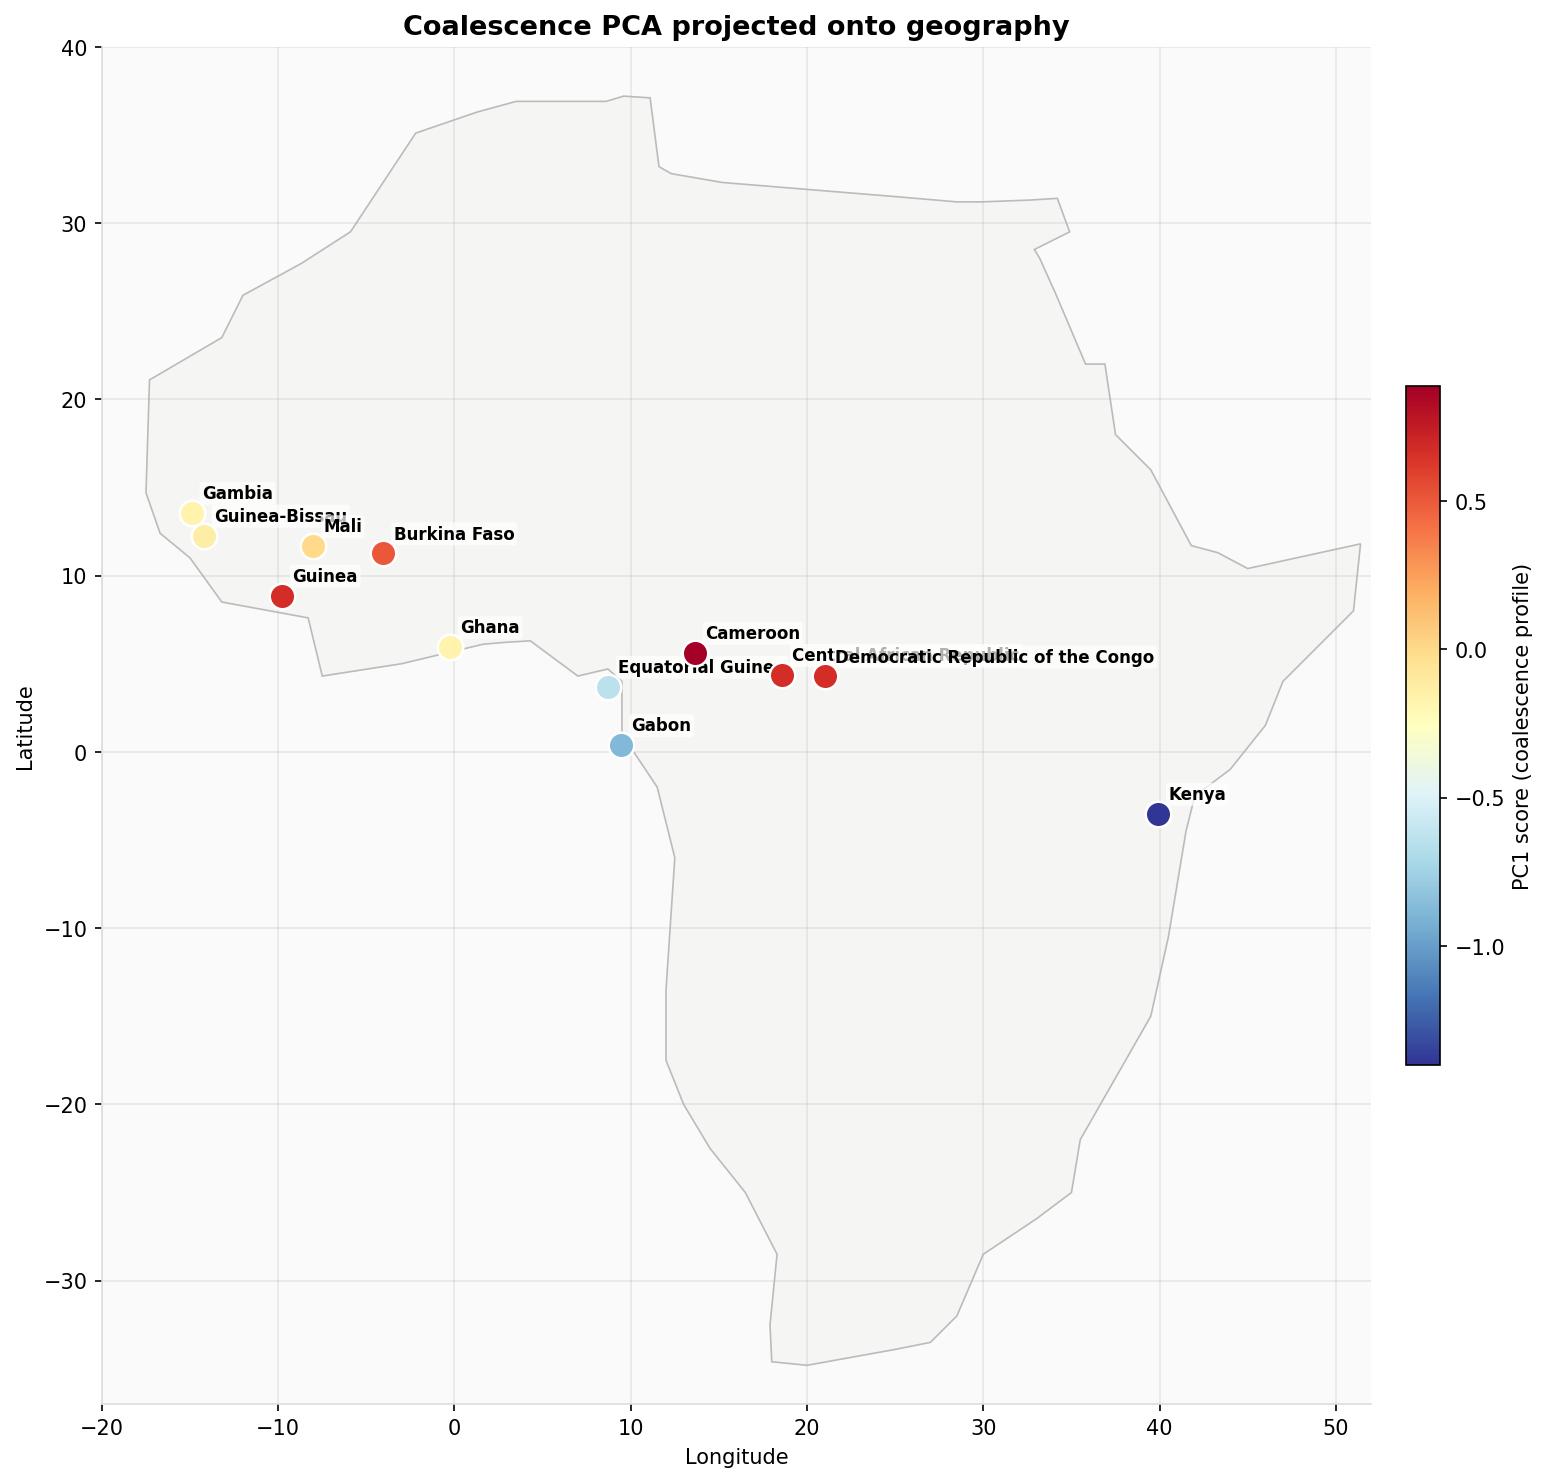
PC1 projected onto geography. A smooth west-to-east gradient in coalescence profiles mirrors geographic distance.
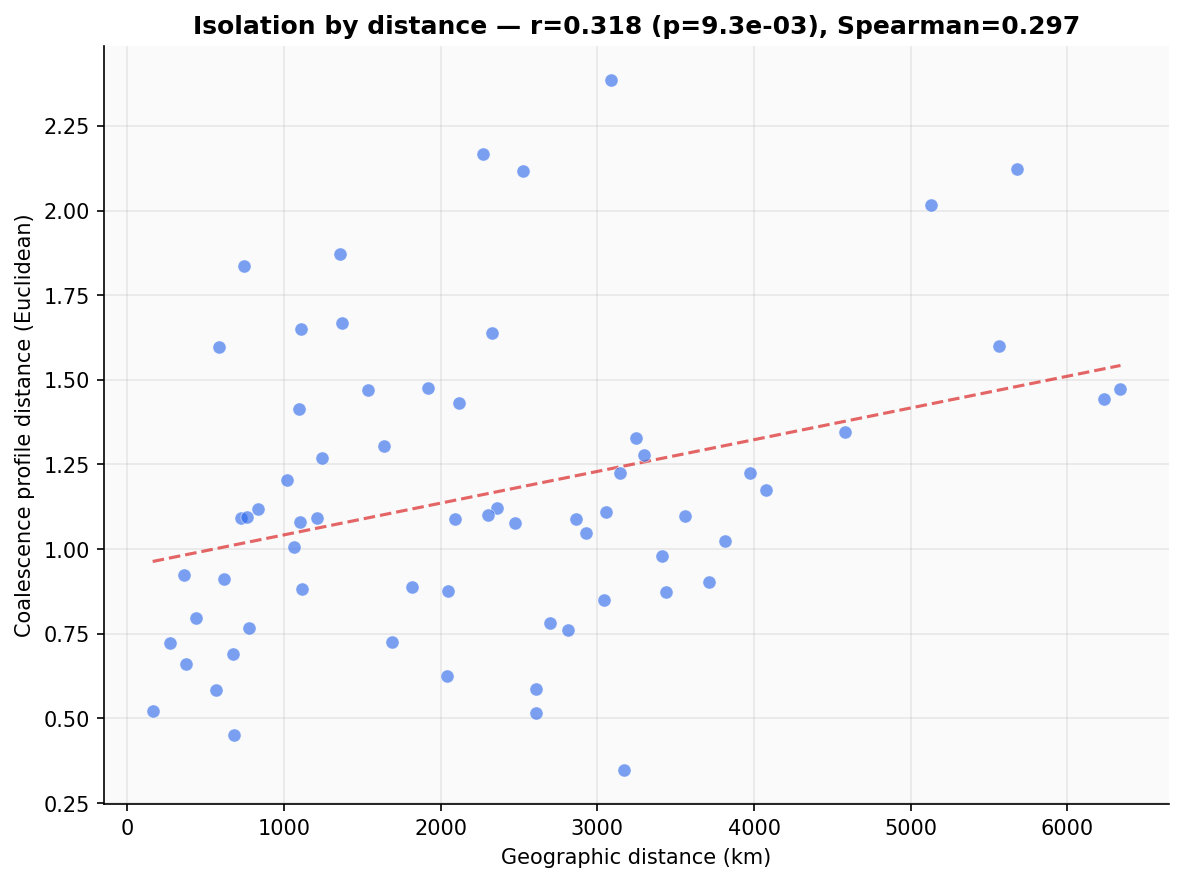
Geographic distance vs coalescence profile distance (r = 0.318, p = 0.009). Dots = within-region pairs, crosses = between-region pairs.
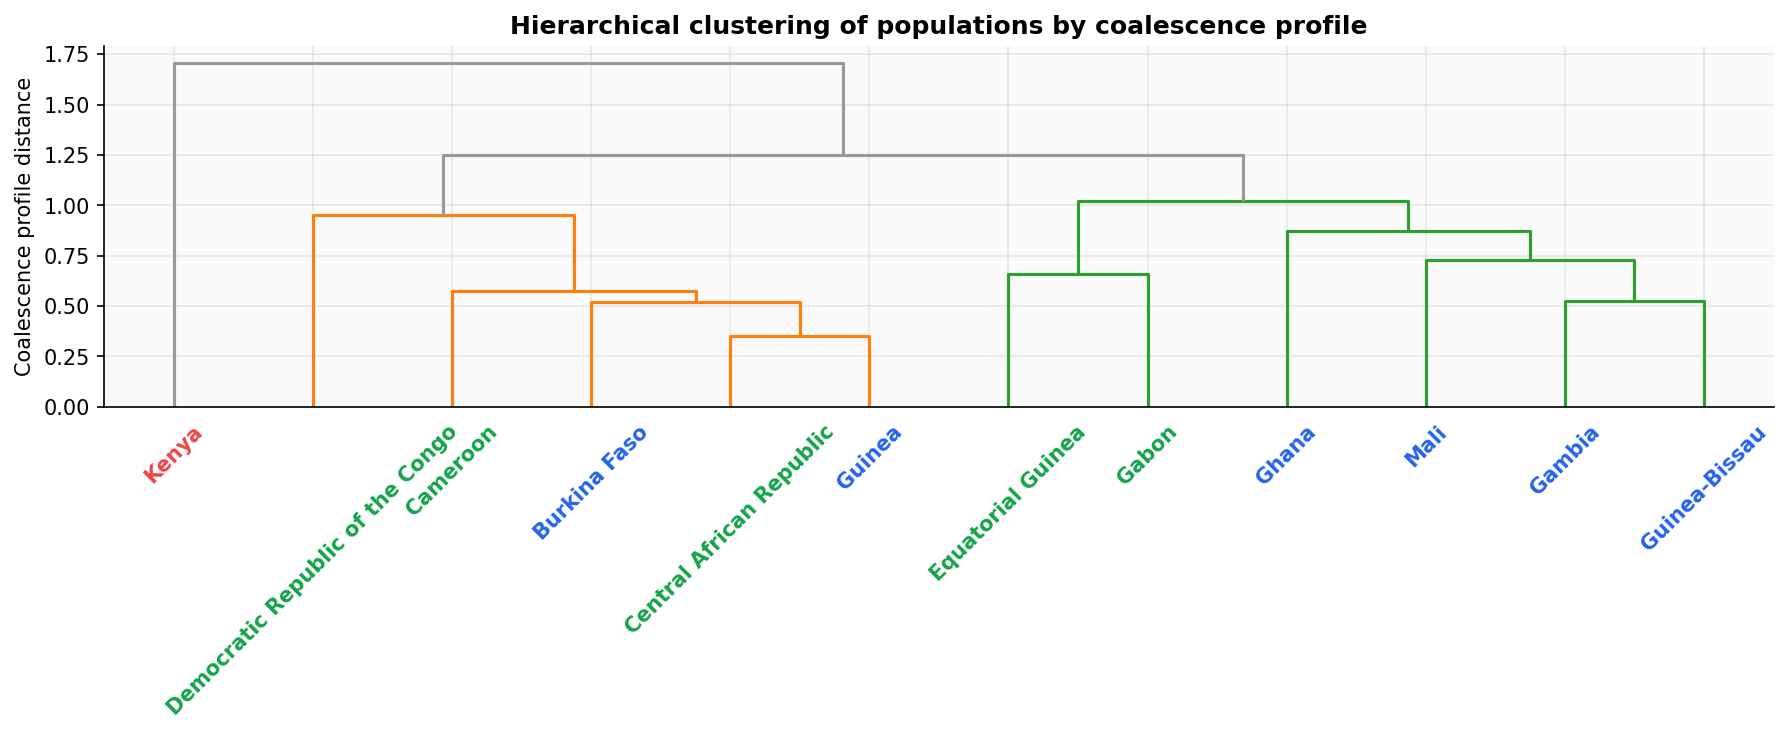
Average-linkage clustering. West African populations form a tight cluster, Central African populations group together, Kenya is an outgroup.
High-Resolution Structure
PCA and UMAP using per-block TMRCA profiles across 950 genomic blocks (3L + 3R), capturing fine-scale coalescence variation rather than just population means.
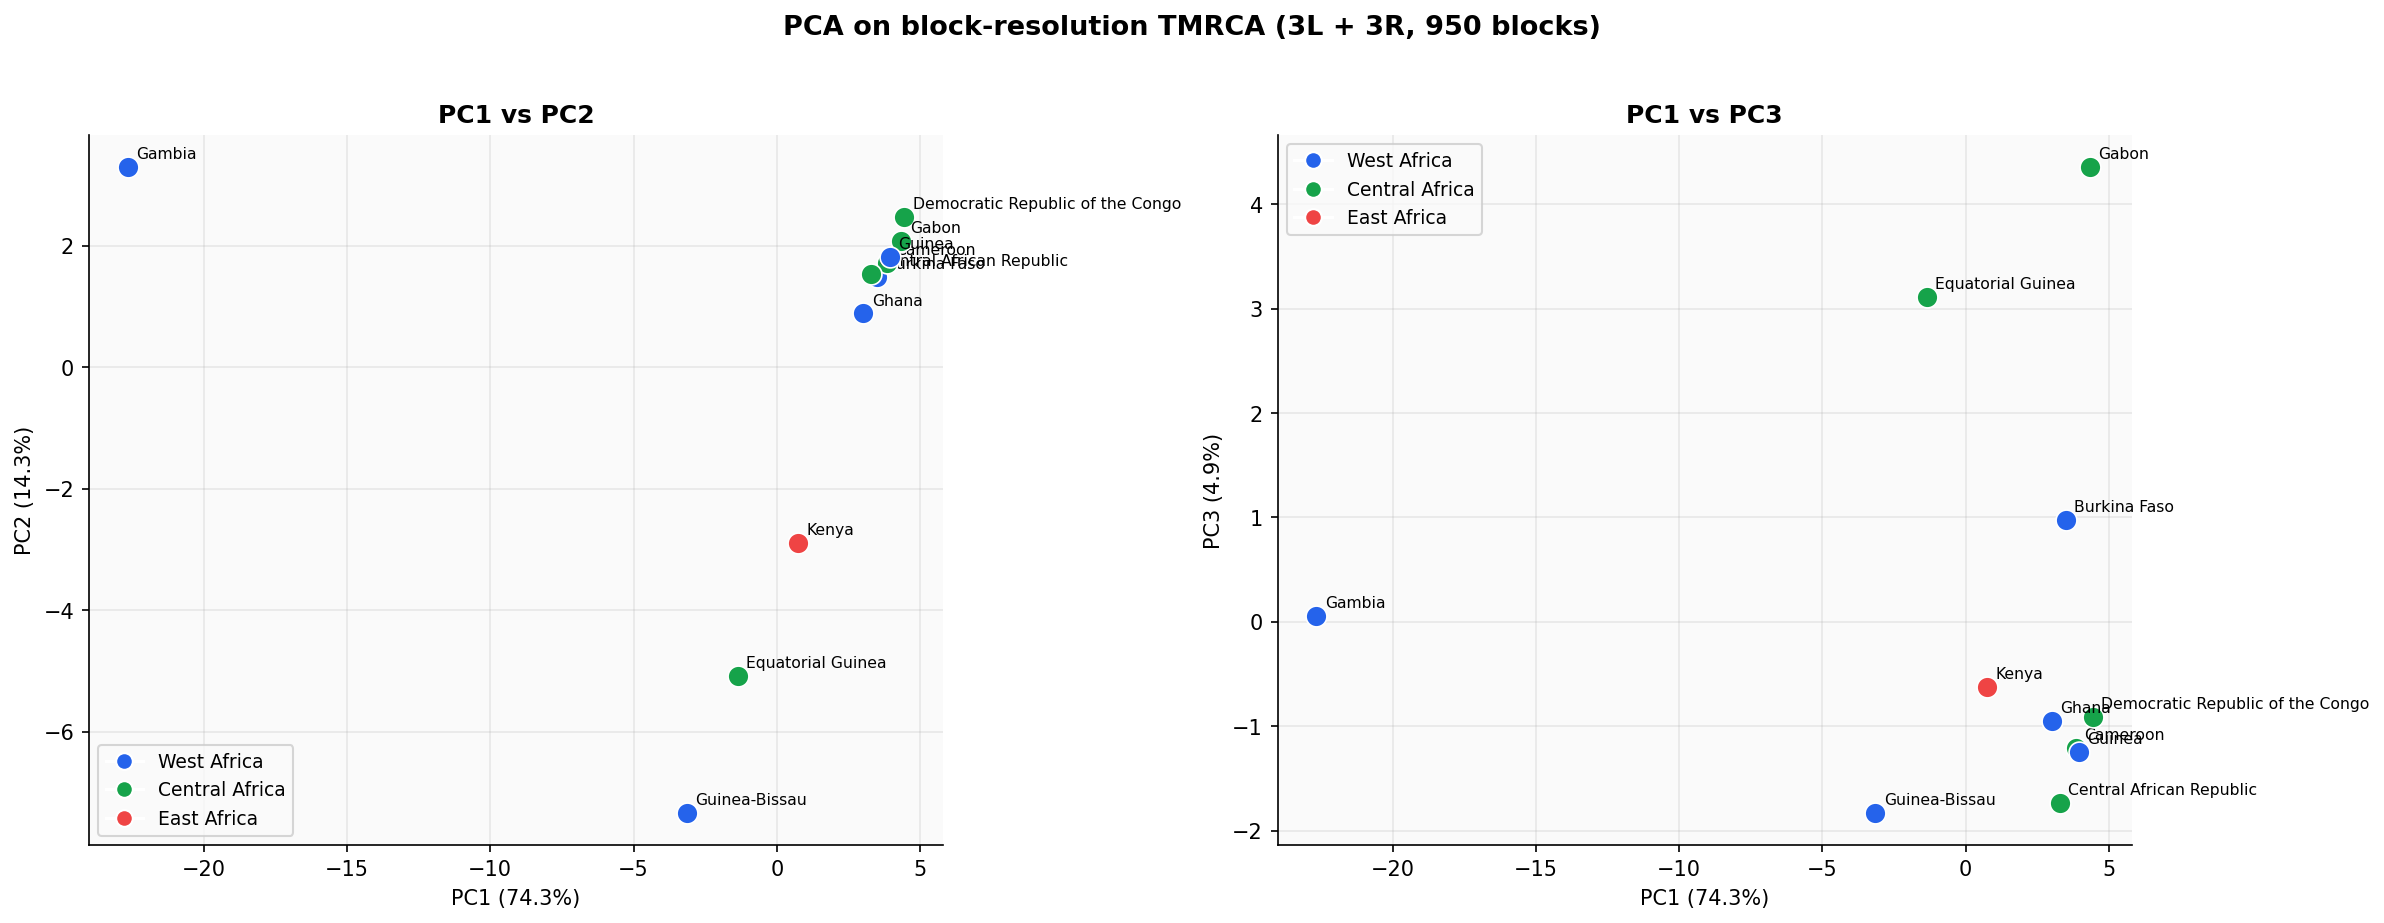
PCA on block-resolution TMRCA profiles. PC1 (74%) captures the dominant west-to-east differentiation axis.
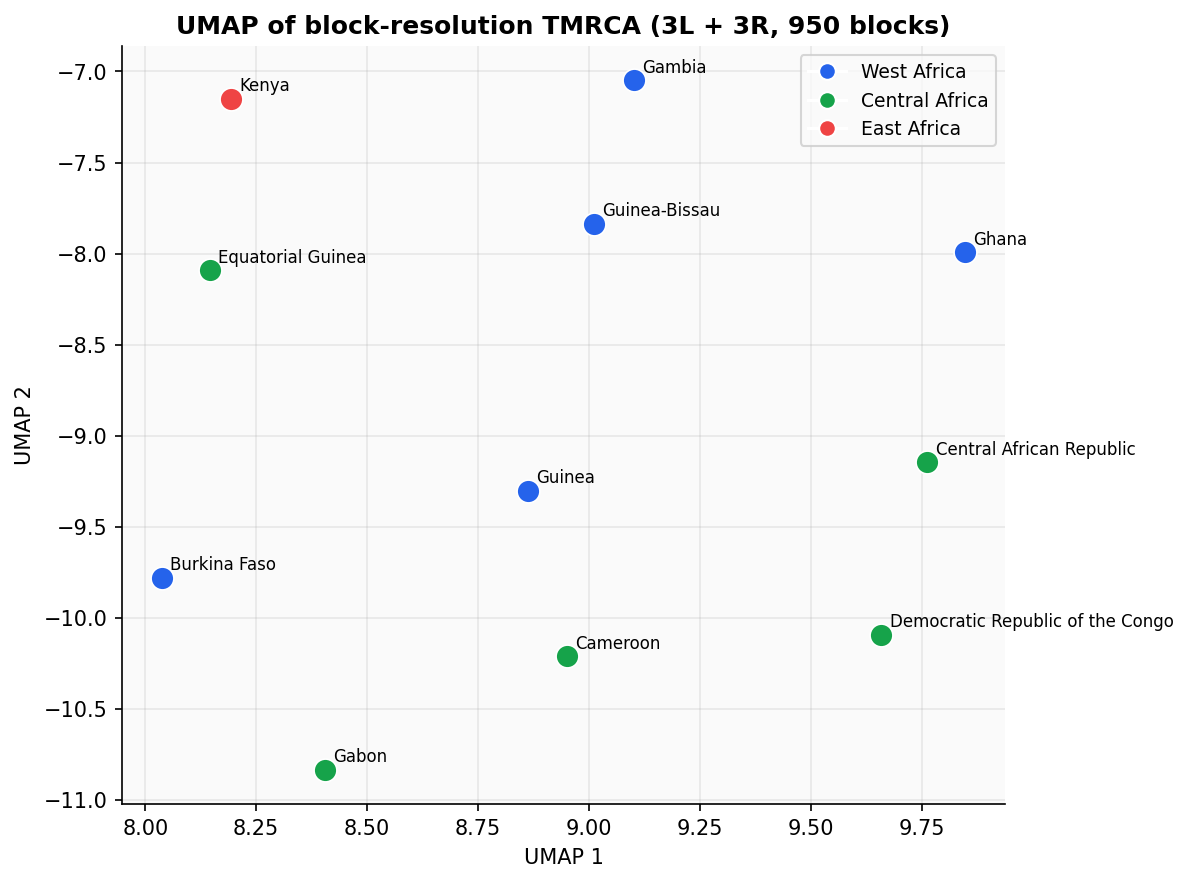
UMAP embedding reveals finer population clustering: West African populations separate from Central, with Kenya and Gambia as outliers.
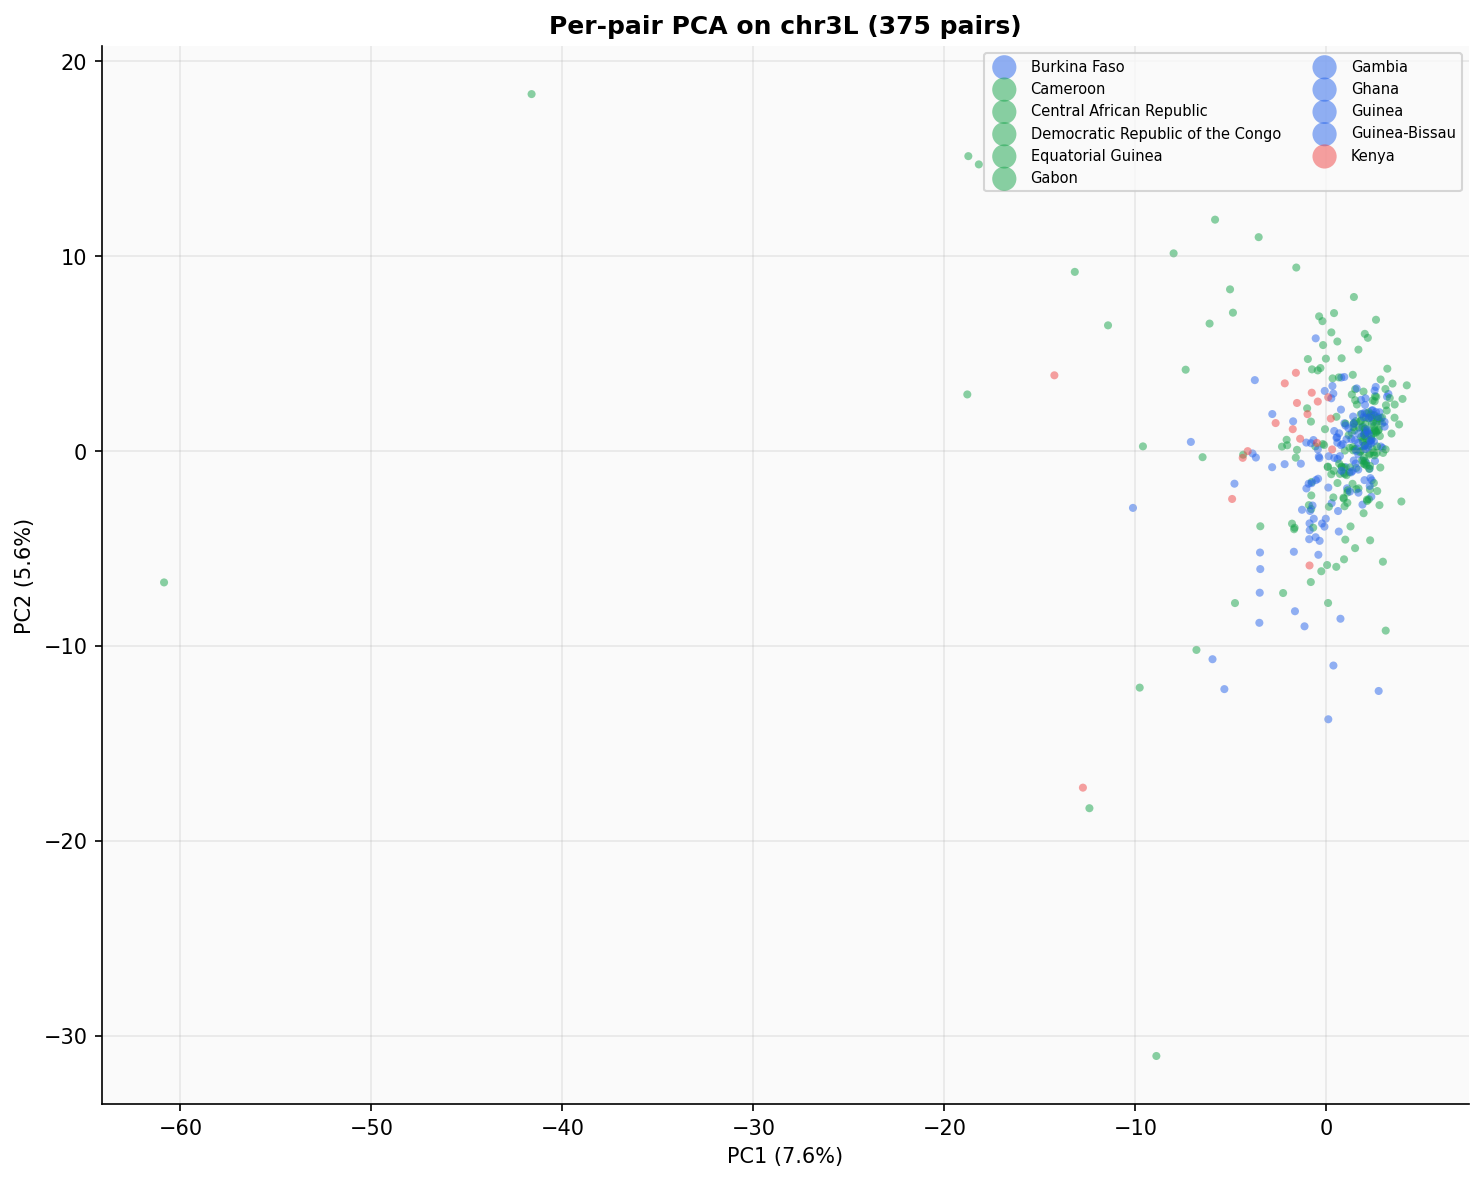
Per-pair PCA on chr3L (375 individual haplotype pairs). Each dot is one within-individual pair, colored by population. Populations form overlapping but distinguishable clouds.
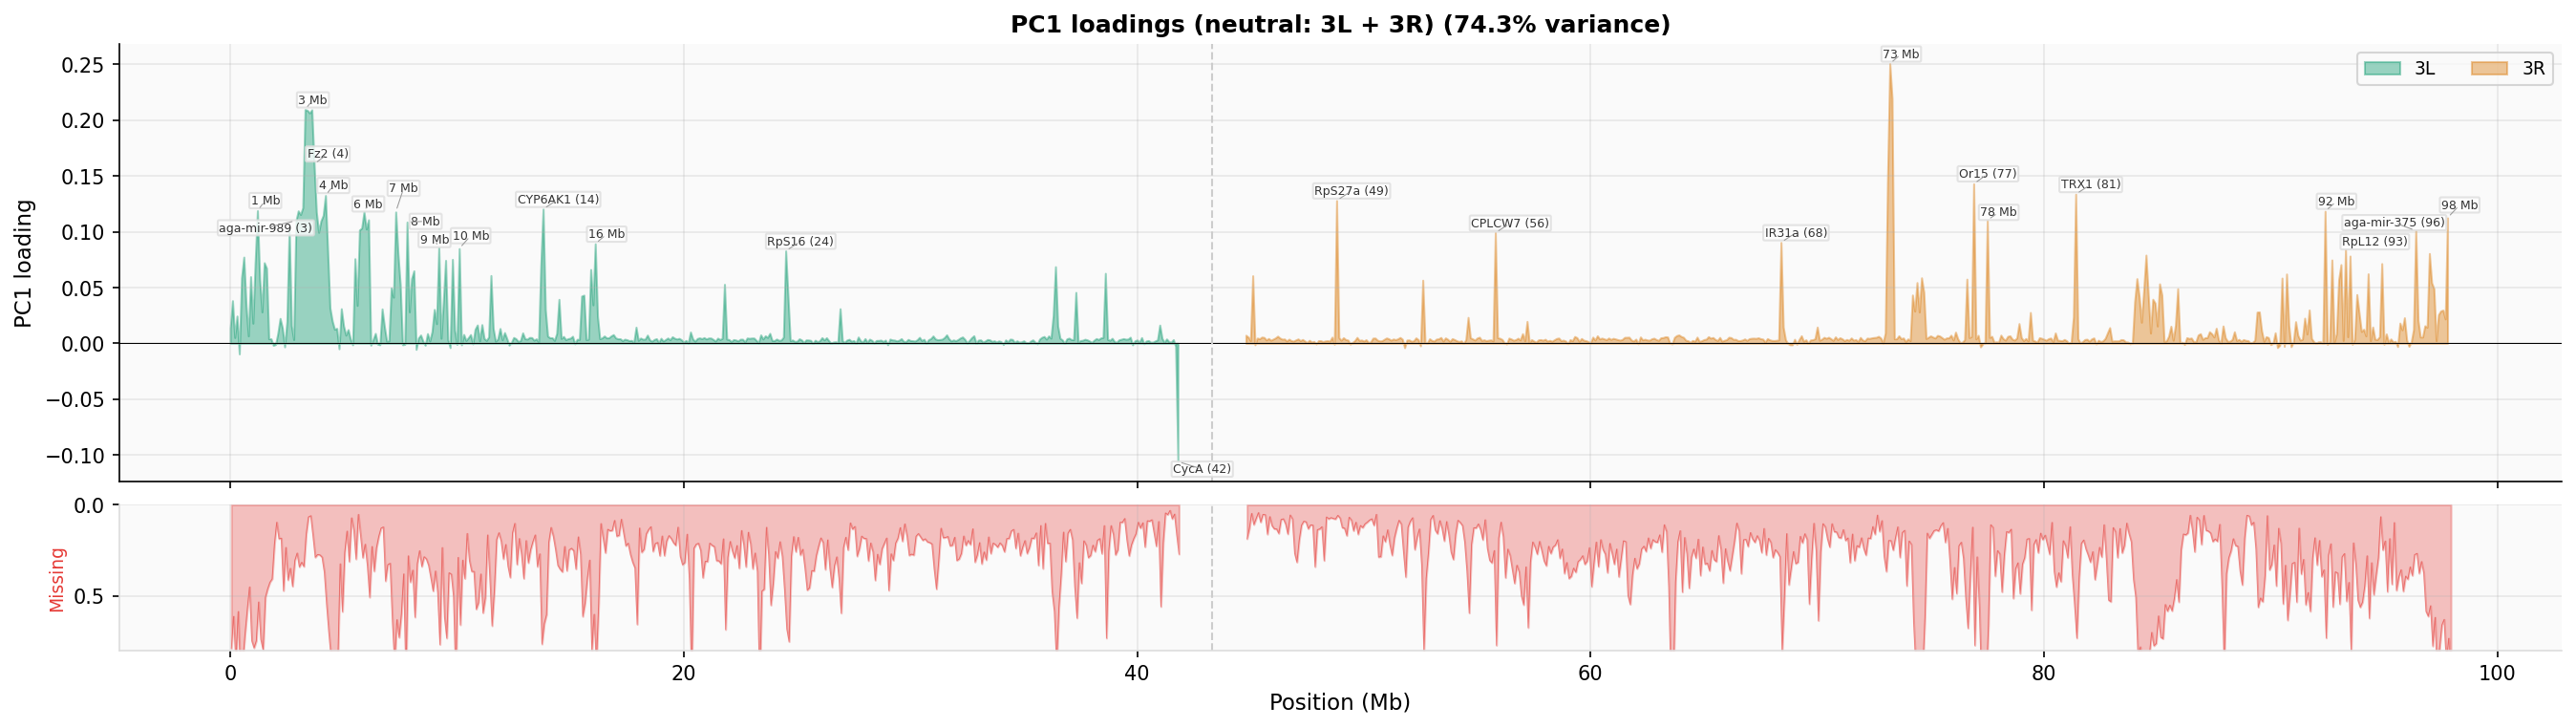
PC1 loadings across 3L and 3R with gene annotations (AGAP IDs) at peak positions. Bottom track shows raw data accessibility (missingness). Peaks indicate candidate regions for geographically varying selection.
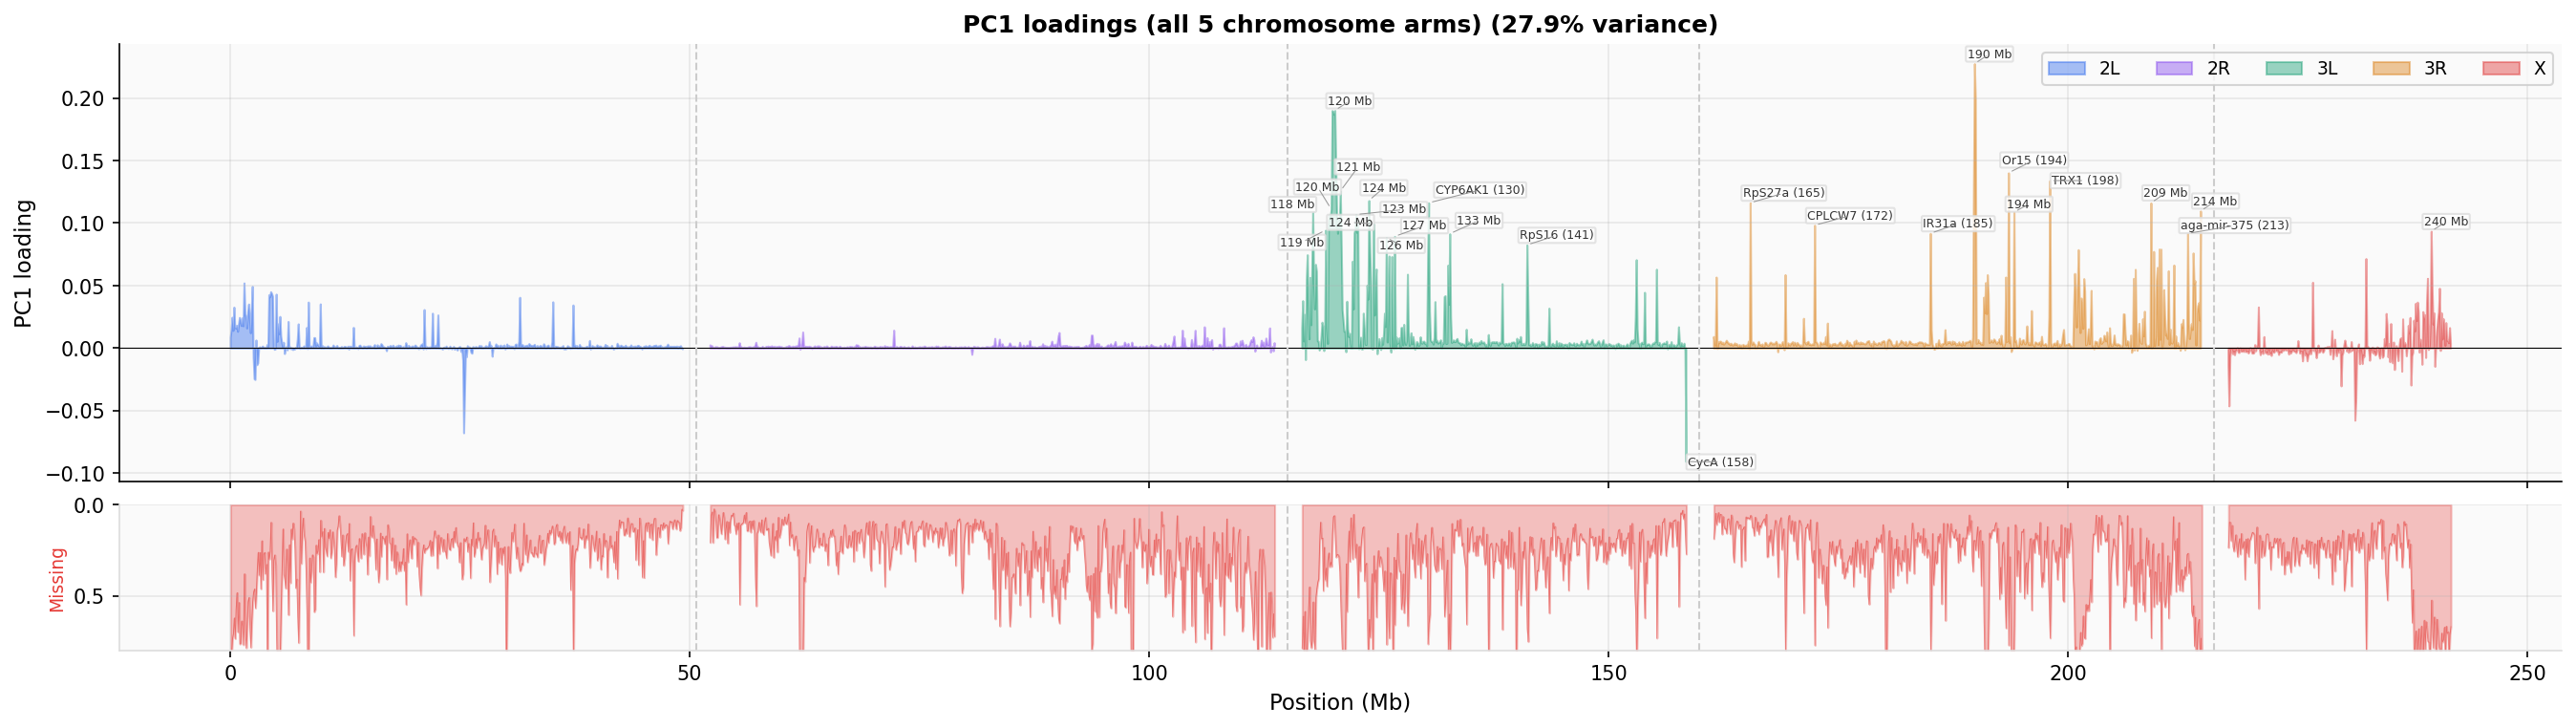
PC1 loadings across all 5 chromosome arms (2L, 2R, 3L, 3R, X) with gene annotations and accessibility track. The full ~230 Mb genome in one view.
Gene Region Zooms
High-resolution TMRCA profiles (200 bp windows) at candidate gene regions, comparing all populations. Bottom track shows coefficient of variation across populations — peaks indicate regions of geographically varying coalescence.
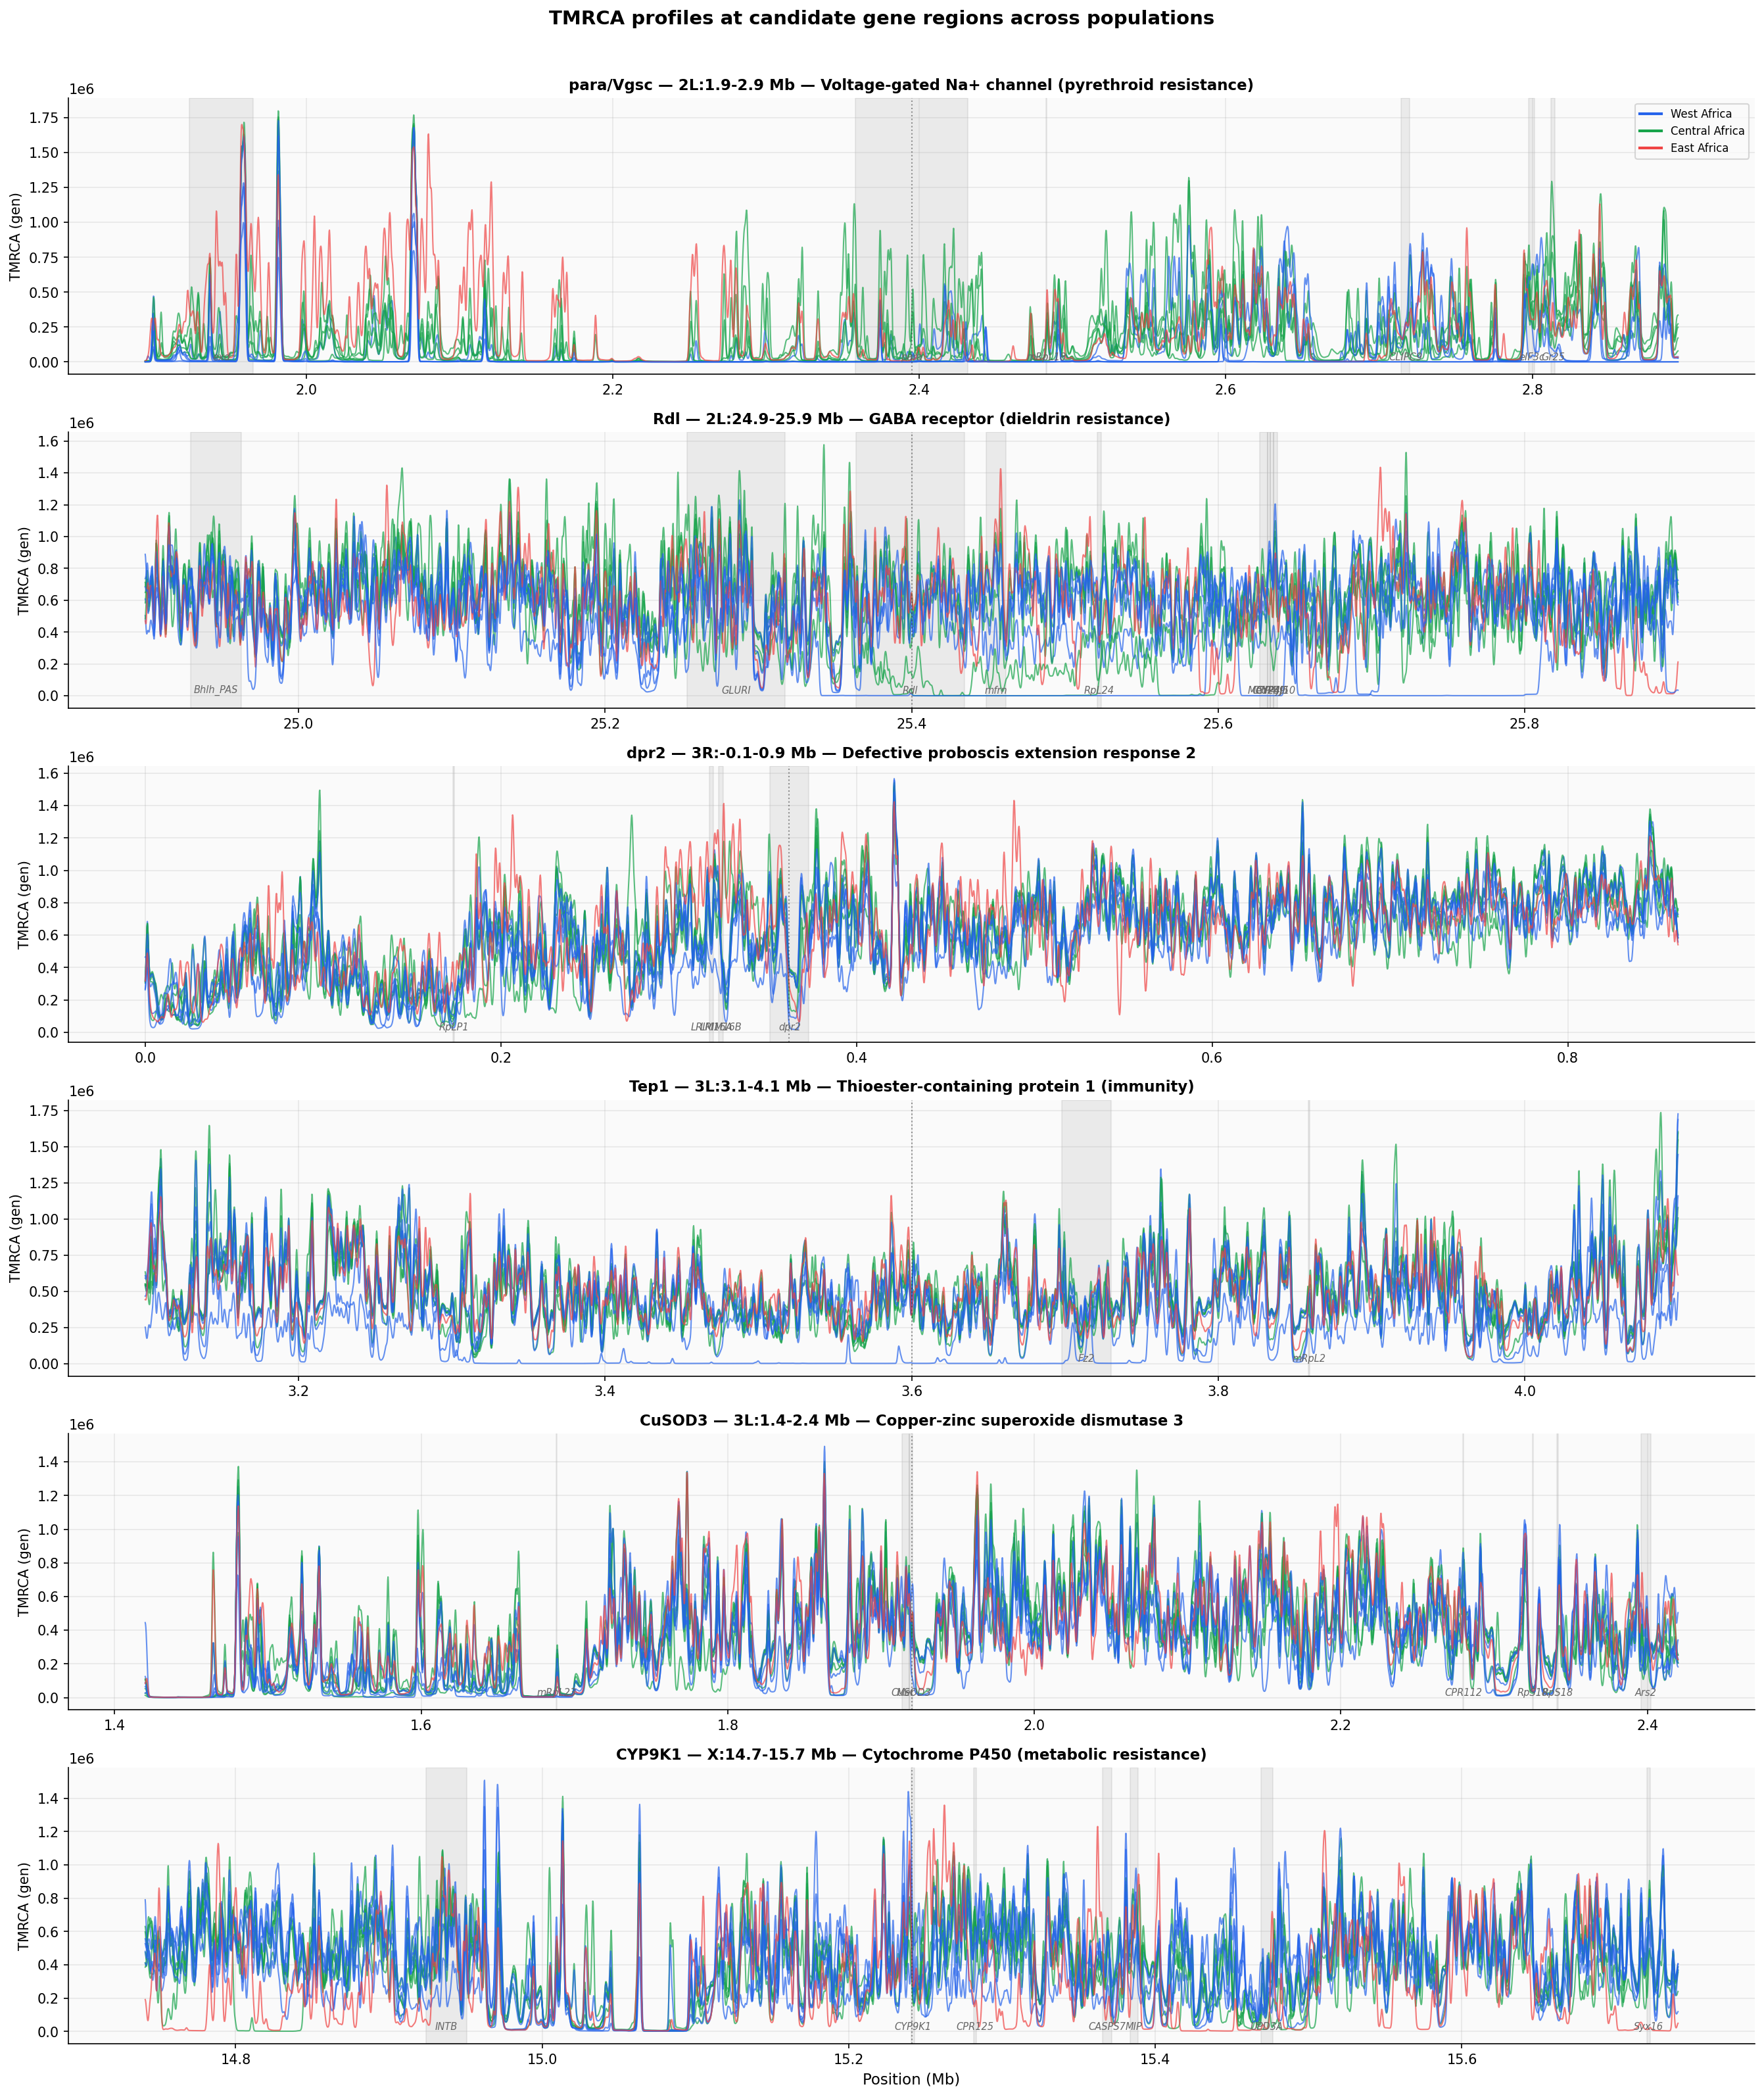
Six candidate gene regions: para/Vgsc (pyrethroid resistance), Rdl (dieldrin resistance), dpr2 (cell adhesion), Tep1 (immunity), CuSOD3 (oxidative stress), CYP9K1 (metabolic resistance). Each panel shows median TMRCA per population (blue = West, green = Central, red = East Africa).
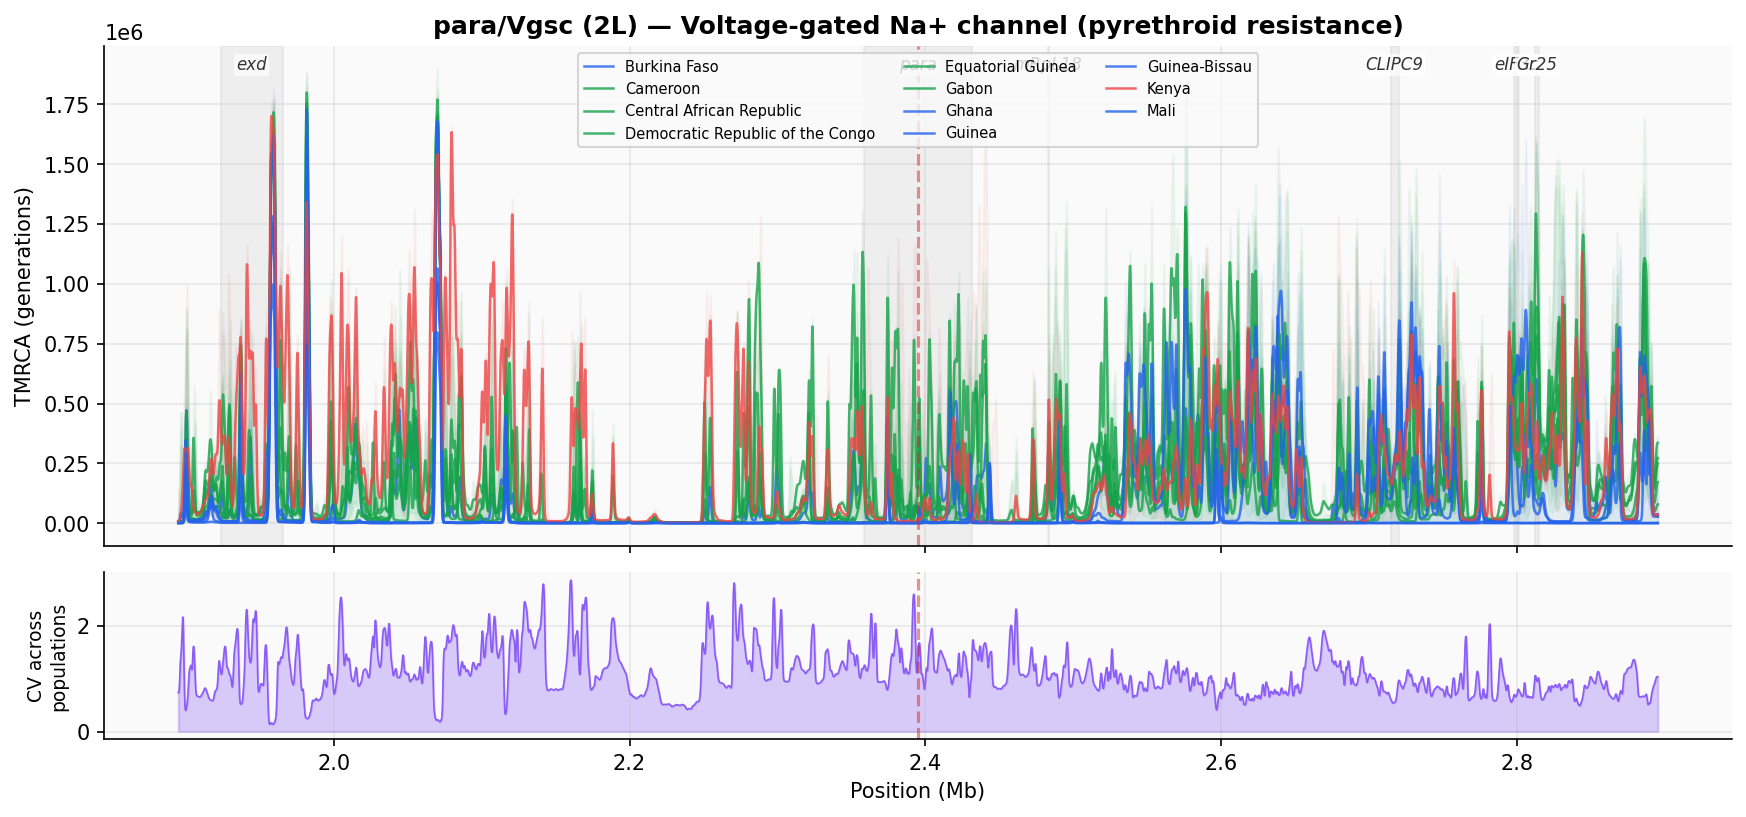
para/Vgsc locus on 2L — voltage-gated sodium channel conferring pyrethroid resistance. Gene bodies annotated. Bottom: CV across populations peaks near the gene, indicating population-specific selection signatures.
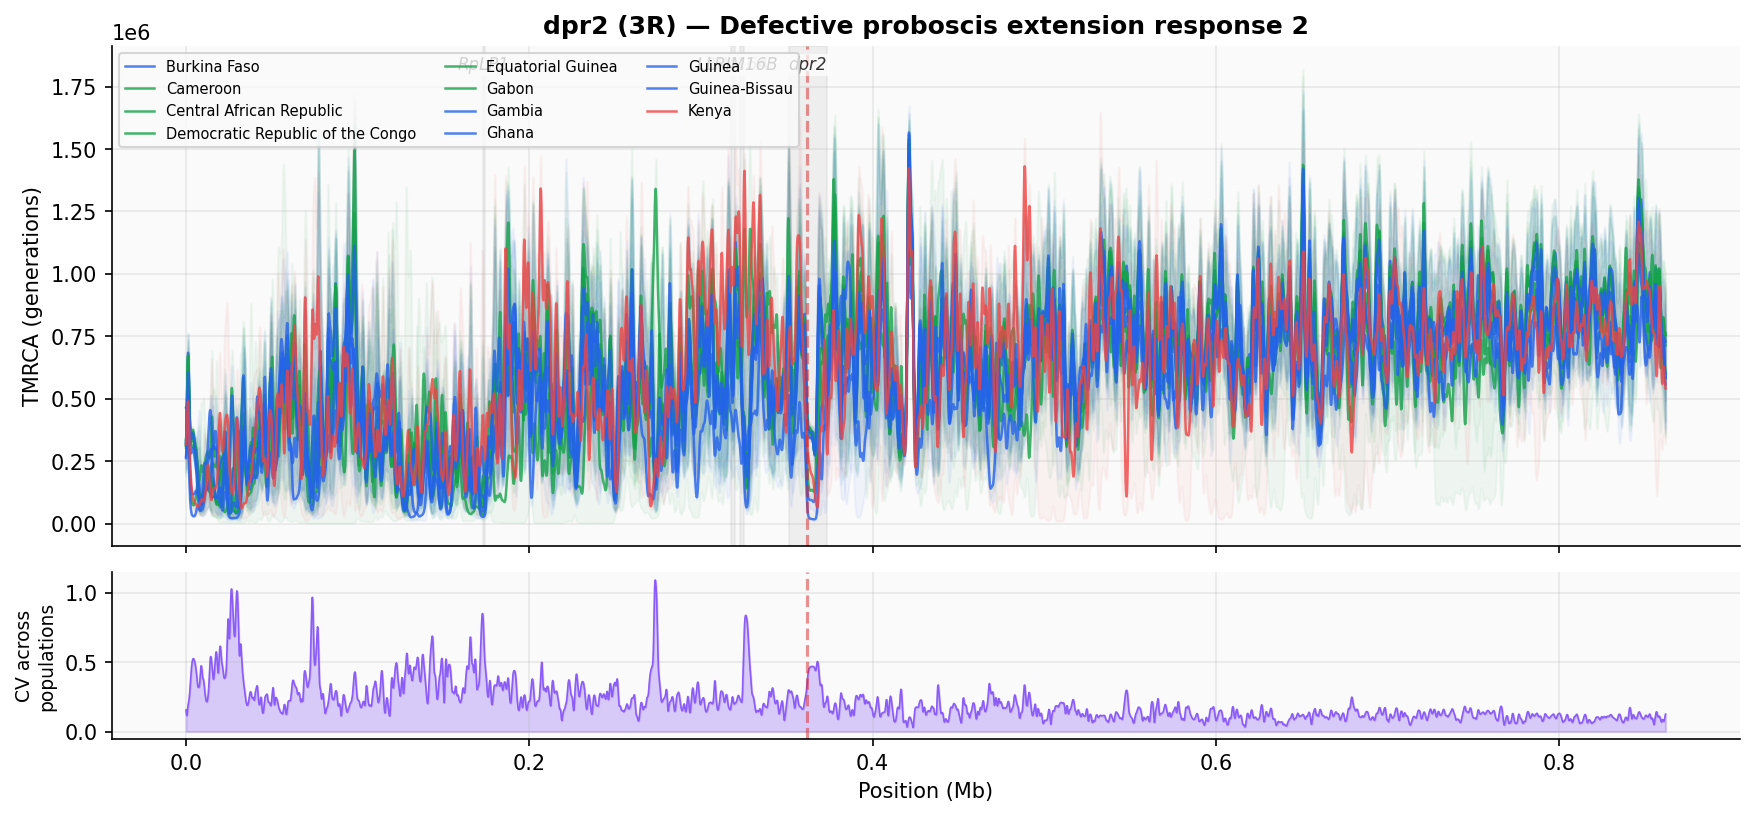
dpr2 locus on 3R — a top PC1 loading peak. Population-specific TMRCA variation visible around the gene.
Statistical Enrichment
Permutation testing and functional enrichment analysis of TMRCA outlier regions and population differentiation peaks.
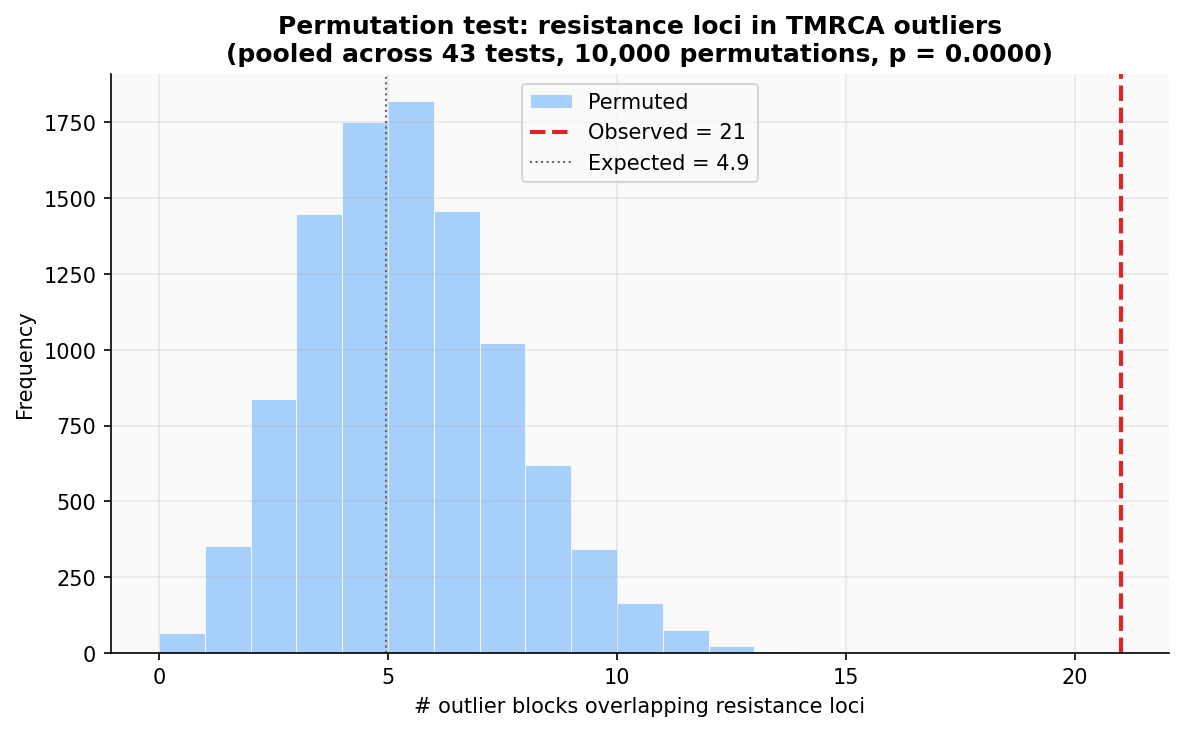
Resistance loci are significantly enriched among TMRCA outlier blocks (p < 0.0001, 10,000 permutations). Observed = 21 overlaps across all populations, expected by chance = 4.9. Individual population tests show strongest signal in Ghana (14.8x fold, p = 0.0005) and DRC (19.8x fold, p = 0.003).
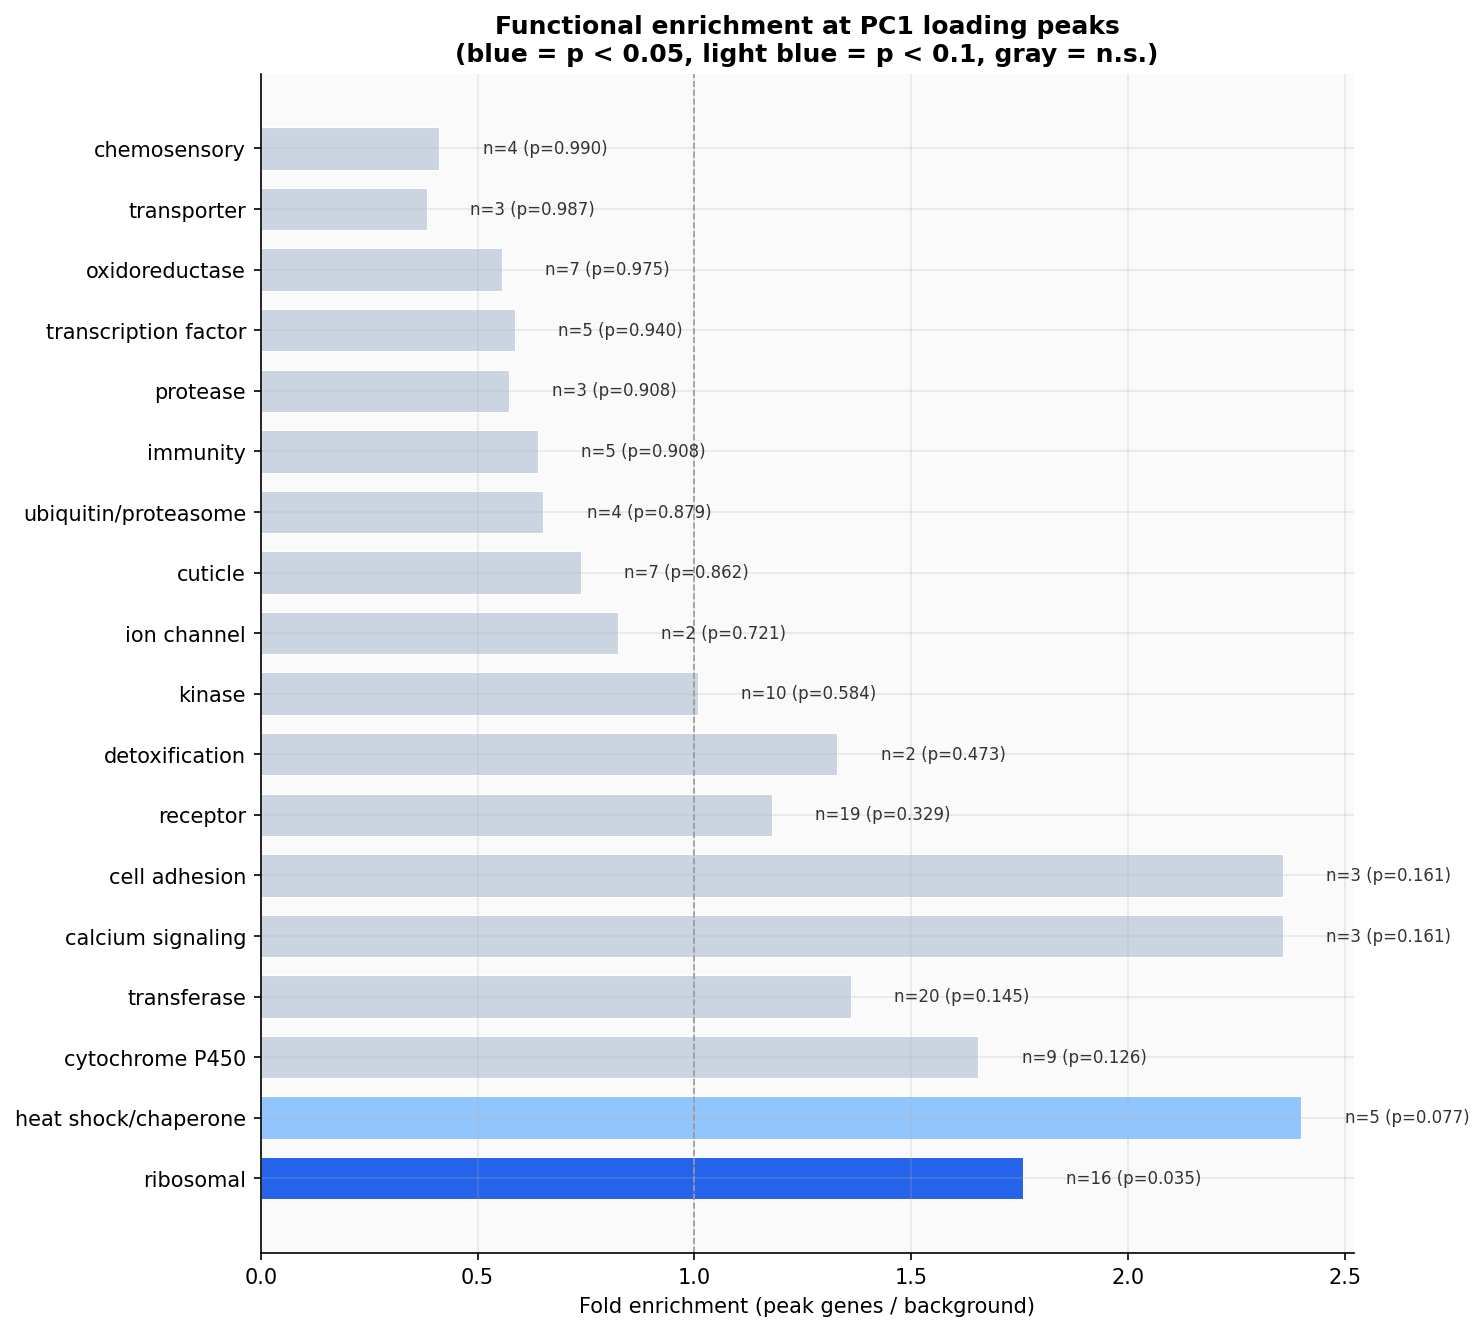
Functional categories enriched at PC1 loading peaks (population differentiation drivers). Ribosomal genes are significantly enriched (1.8x, p = 0.035). Heat shock/chaperone and calcium signaling genes show trends (p < 0.1).
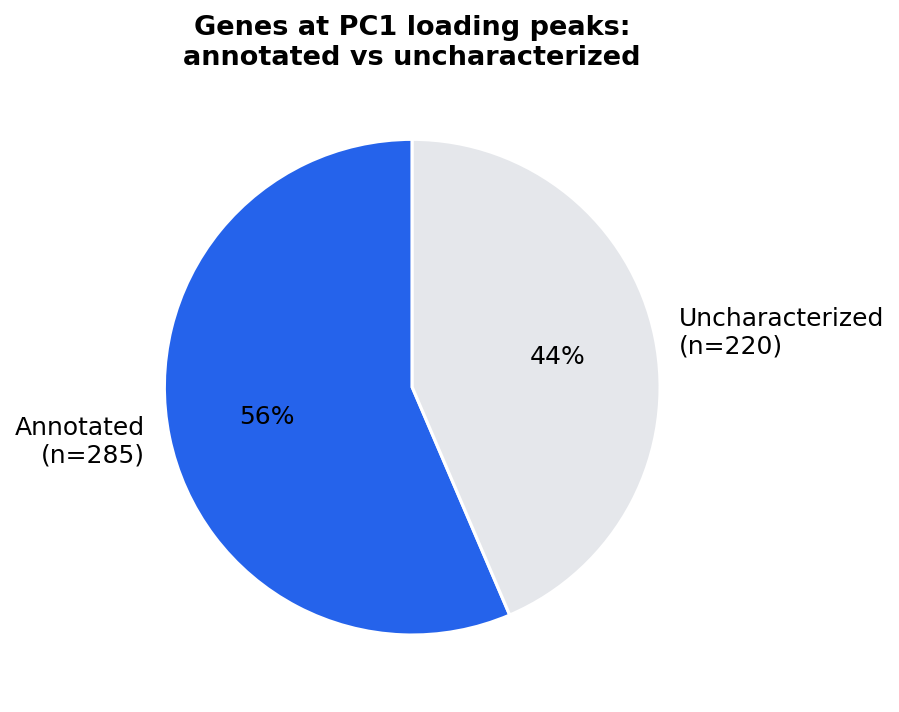
44% of genes at population differentiation peaks are uncharacterized — candidates for functional follow-up.
Progress & Pending Figures
Completed populations (12/16): Burkina Faso, Cameroon, Central African Republic, Democratic Republic of the Congo, Equatorial Guinea, Gabon, Gambia, Ghana, Guinea, Guinea-Bissau, Kenya, Mali (all 5 arms each).
Currently running: Mayotte on poppy (4 populations remaining).
The following will be generated as inference completes:
Per-population inversion signals (4 remaining)
Full cross-population IICR comparison (all 16 overlaid)
Geographic maps with all populations filled in
Full density grid with all populations (16 rows x 9 cols)